Previous Months
Compare your AWS spend across multiple months to understand trends and cost behavior.
Multi-Month Comparison
- View costs across multiple months side-by-side
- Analyze growth or reduction trends
- Track account-wise and service-wise changes
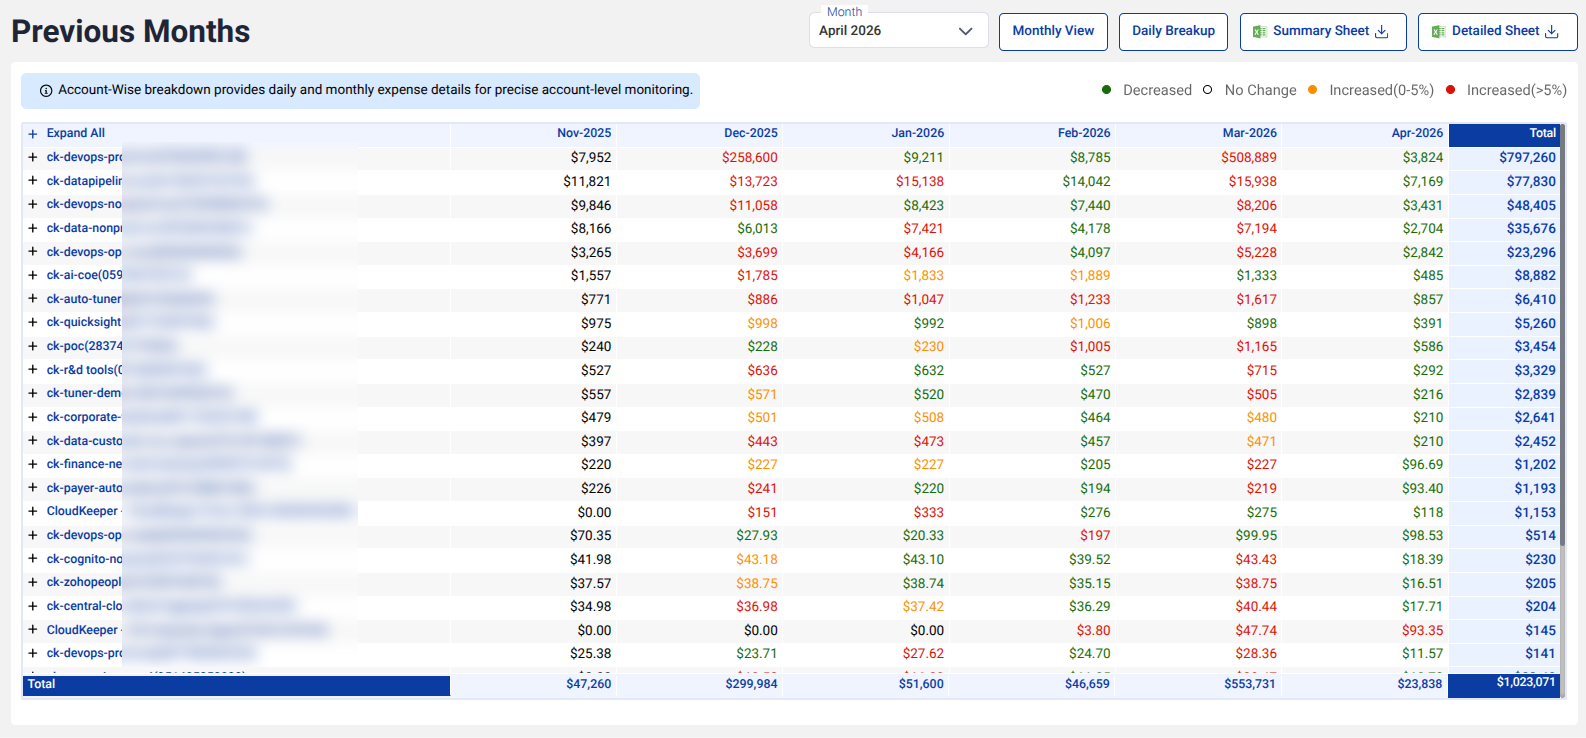
Expand for Detailed View
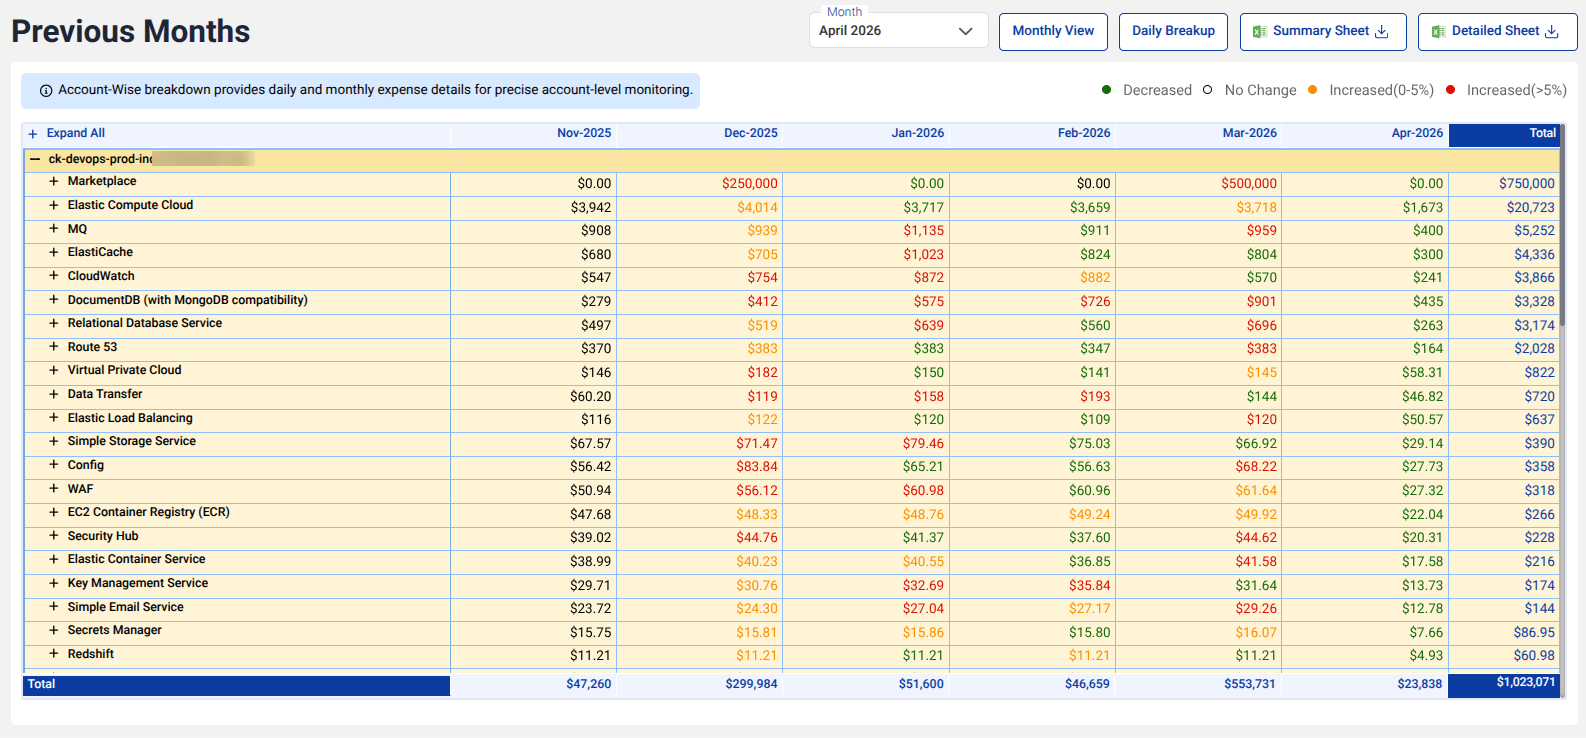
Drill down into any account to see:
- Service-level cost changes
- Region-wise distribution
- Monthly variations
Visual Indicators
Color highlights help you instantly spot trends:
- Green → Decrease
- Orange → Slight increase
- Red → Significant increase
Why use this
- Identify cost spikes over time
- Track seasonal or usage patterns
- Validate impact of optimization efforts