Service-wise Cost Breakup Trend
This section provides a daily breakdown of AWS service-wise spend to help you visually analyze cost changes and spot anomalies quickly.
Key Features
- Daily Cost Tracking: Track cost movement across AWS services for each day.
- Total Summary Row: See aggregate daily spend for all services at the bottom.
- Interactive Controls: Options to toggle between daily, weekly, and monthly views.
- Download Option: The cost data can be exported in
.xlsxformat for deeper analysis or reporting needs.
Sample Heatmap View
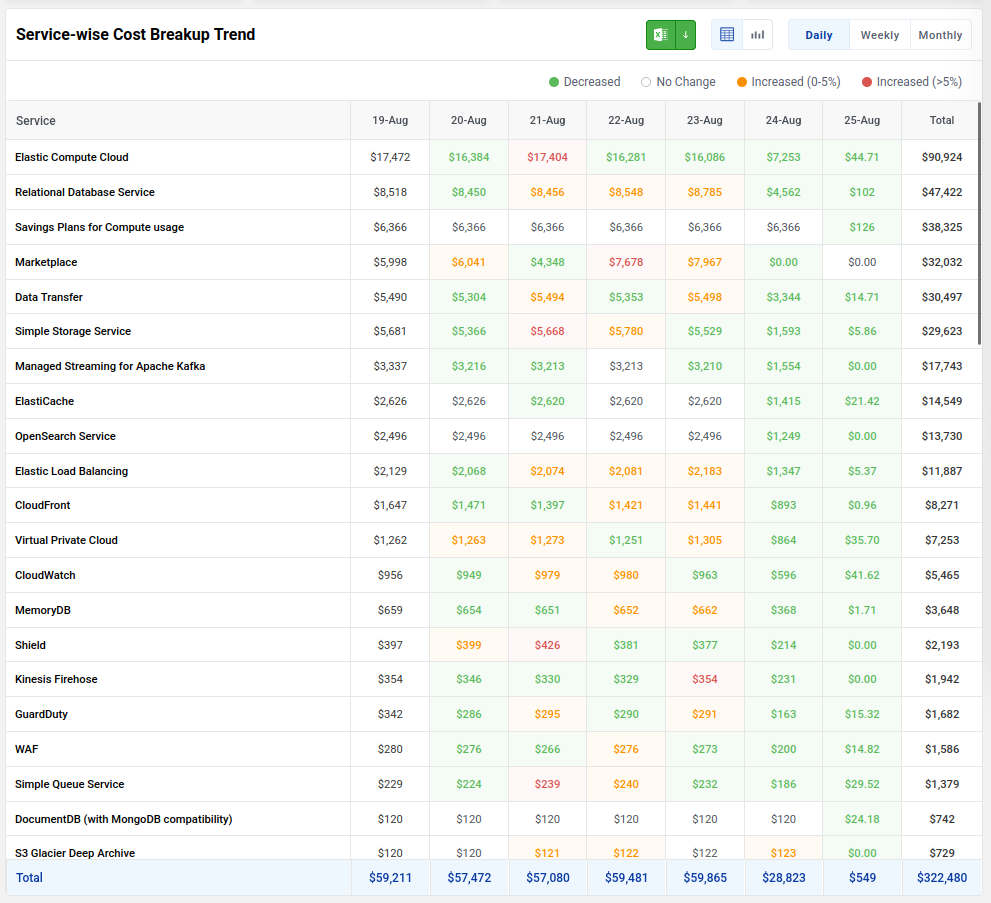
This visualization helps users quickly identify services with unusual spending behavior and take timely actions to optimize cloud costs.