Reports
The Reports page provides a comprehensive way to analyze your AWS costs and resource usage across accounts, tags, and time periods. With this feature, you can generate consolidated tag-based reports for a unified view of your spending.
Accessing Reports
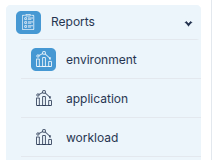
All your configured tag-based reports can be accessed under the Reports section in the navigation panel.
Key Features
-
Tag-Based Grouping: Reports can be generated based on tags (cost allocation tags) that you have created and linked to various MAVs (Multi-Account Views). This allows you to see resources grouped by tag values such as
dev,prod, etc., regardless of which account they are in.
Go to Tags Page → -
Cross-Account Visibility: Consolidates resource costs across multiple accounts that share the same tag keys, helping you understand total spend for specific environments, teams, or workloads.
-
Untagged Resources: Resources that do not have the selected tag key are automatically grouped under Untagged, so you can identify and address missing tags.
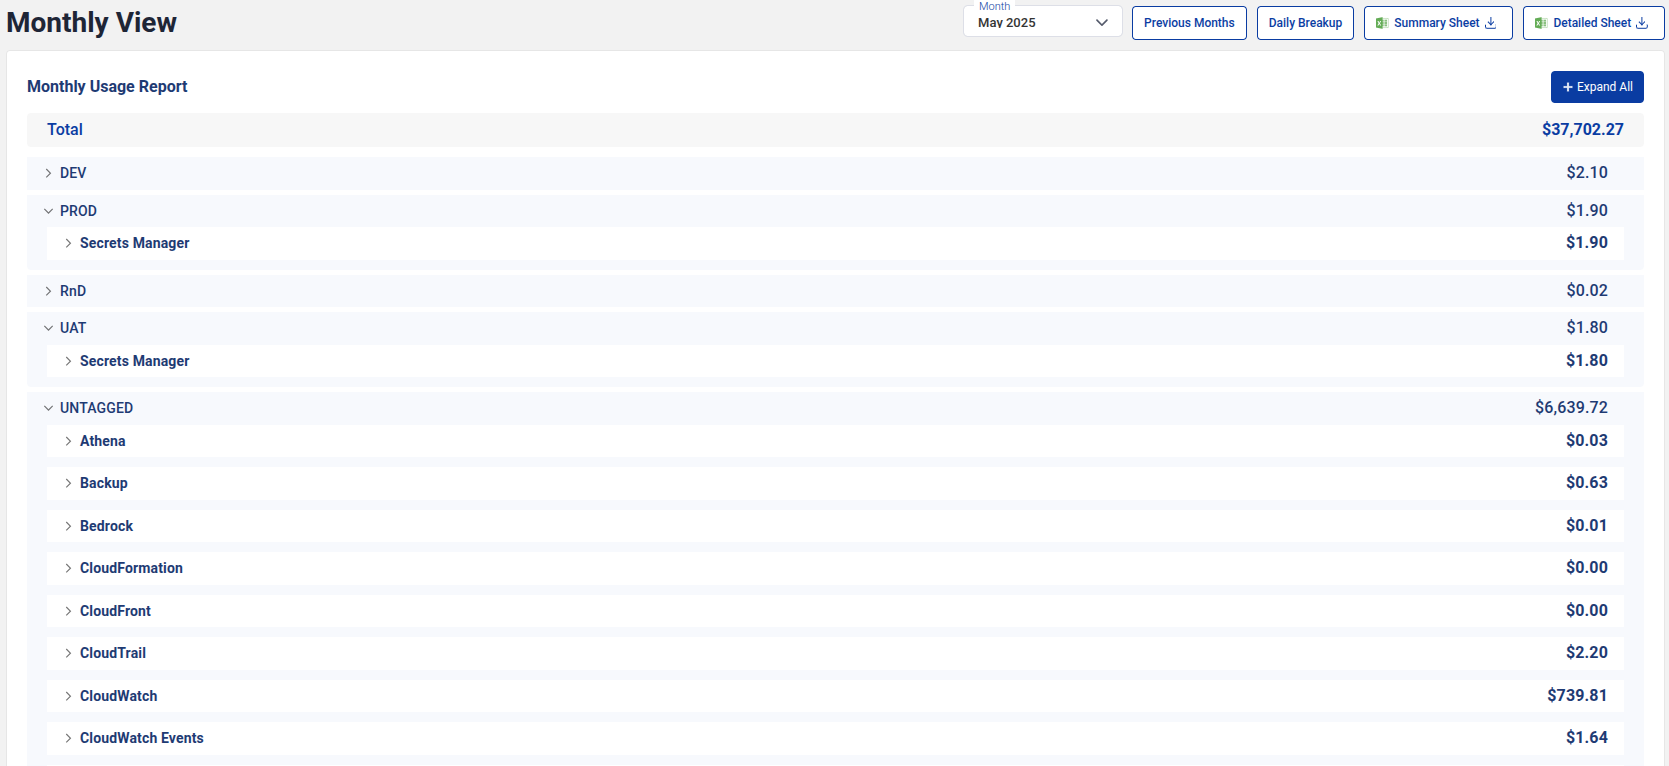
Monthly View
The Monthly View shows a breakdown of your costs for a selected month. You can expand each tag value to see service-level details.
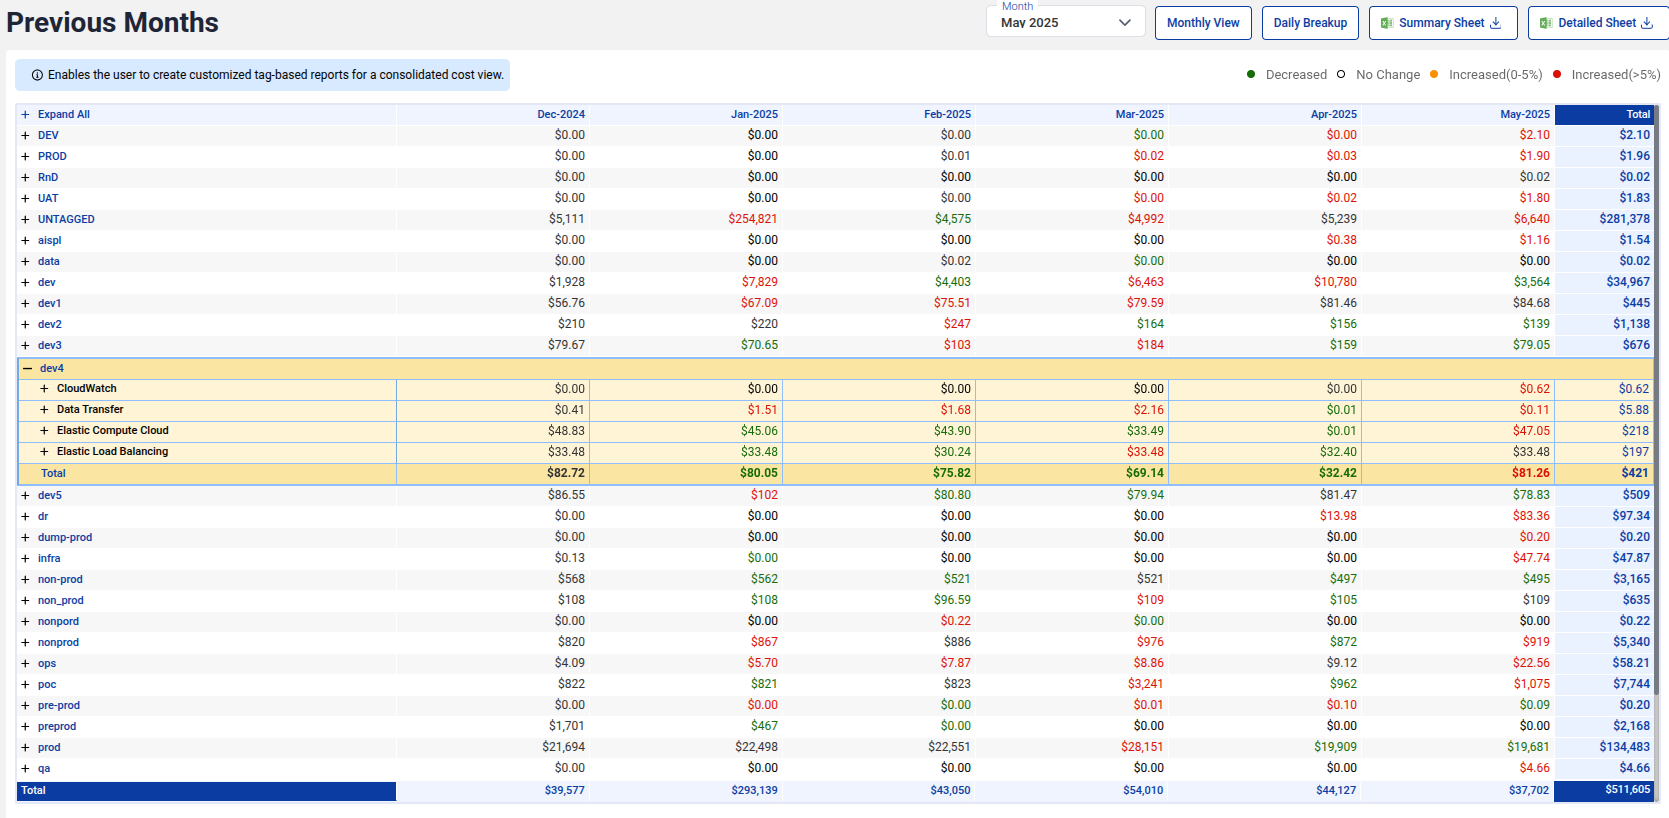
Previous Months
The Previous Months view enables you to analyze cost trends across multiple months. This view provides a comparative breakdown to help track spending changes over time.
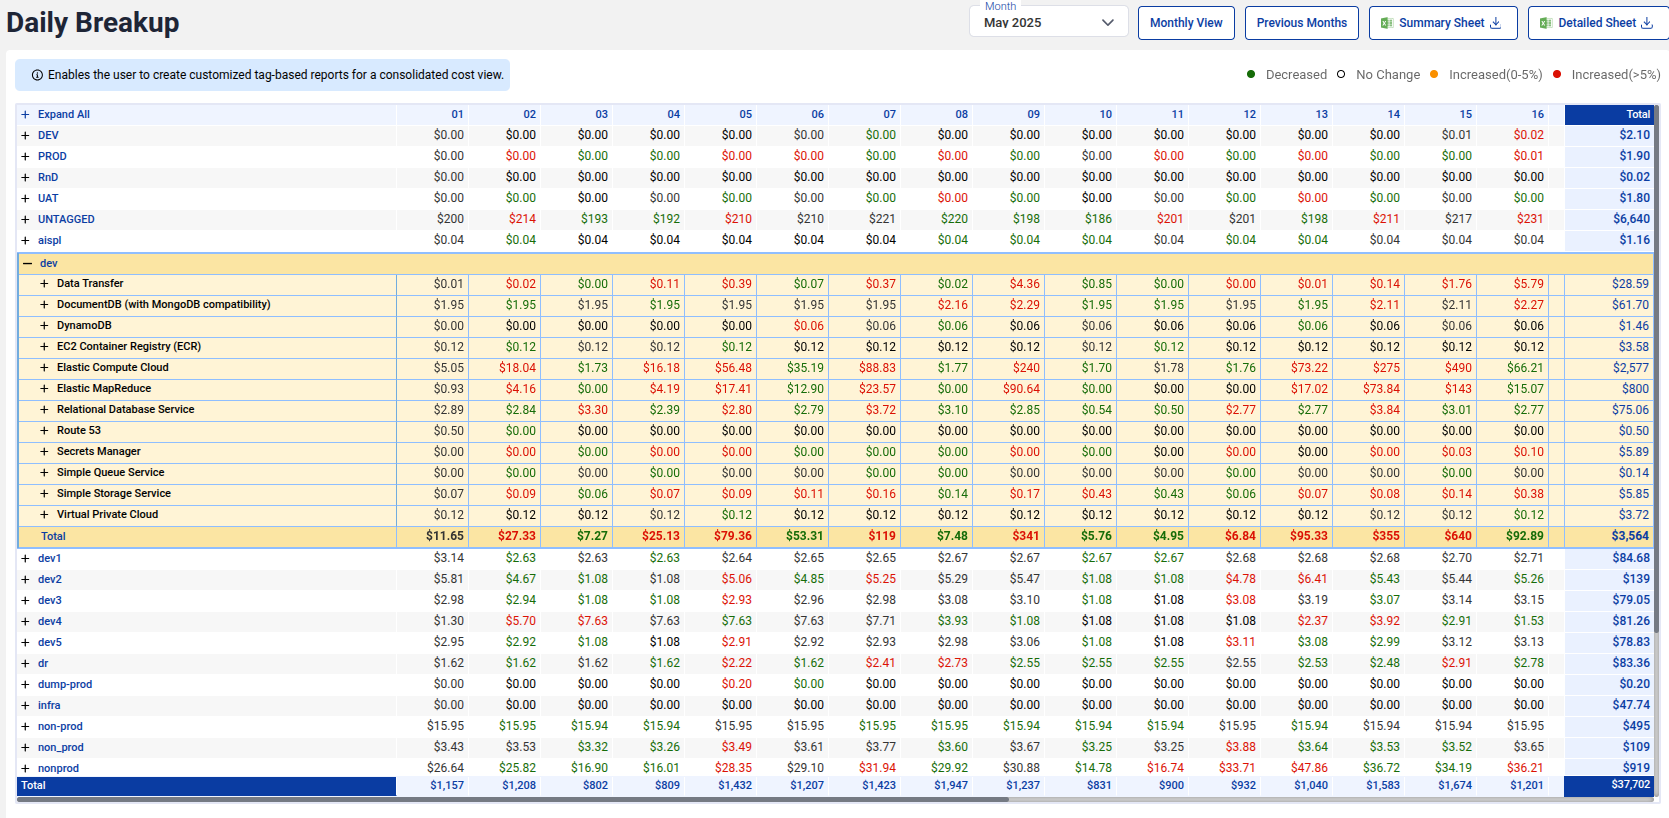
Daily Breakup
The Daily Breakup view provides a day-by-day cost analysis within a selected month. This granularity allows you to identify sudden cost spikes or usage changes and take immediate action.
Export Options
You can download:
- Summary Sheet: High-level summary of costs grouped by tags or accounts, useful for quick reviews and presentations.
- Detailed Sheet: Detailed breakdown including individual services and daily usage, ideal for in-depth analysis and audits.
These options make it easy to share reports with finance teams or other stakeholders.