Daily Breakdown Overview
The Daily Breakdown page provides a granular, day-by-day view of your AWS spend for the current month. It helps you track daily fluctuations, identify cost anomalies, and monitor service-wise usage trends effectively.
Features
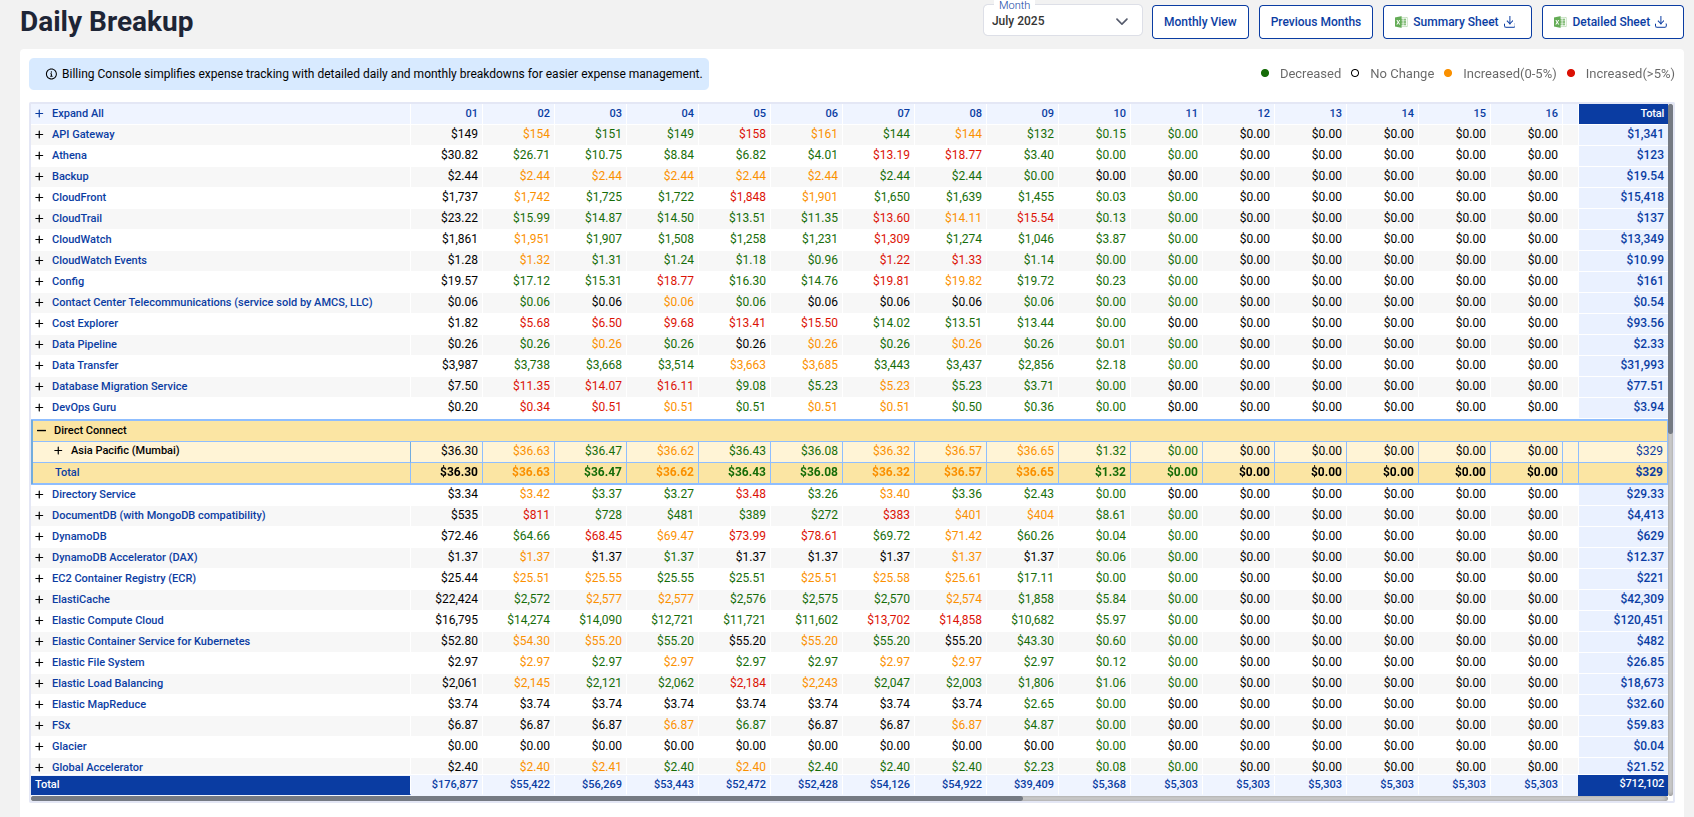
- Daily Cost Table: View total daily costs and compare spending across each day to spot anomalies or spikes.
- Cost Trends Graph: Visualize spending fluctuations with a line or bar graph to identify trends or unusual surges in usage.
- Service-wise Daily Breakdown: Analyze how much each AWS service (like EC2, S3, or Data Transfer) contributed to your costs on a given day.
This detailed breakdown supports better cost control, anomaly detection, and resource optimization.