Previous Months Overview
This page provides a comparison of your AWS spending between the current month and the previous months. It helps you understand spending trends, identify cost fluctuations, and make informed decisions for optimizing your cloud usage going forward.
Total Spend Comparison
The Total Spend for the previous month reflects the cost incurred in the months prior. This metric allows you to compare your previous month’s actual costs with the current month's spending to assess trends and changes.
- Previous Month Spend: $854,635
- Current Month Spend: $712,102
This comparison helps you evaluate spending trends and pinpoint areas where costs have decreased or increased significantly.
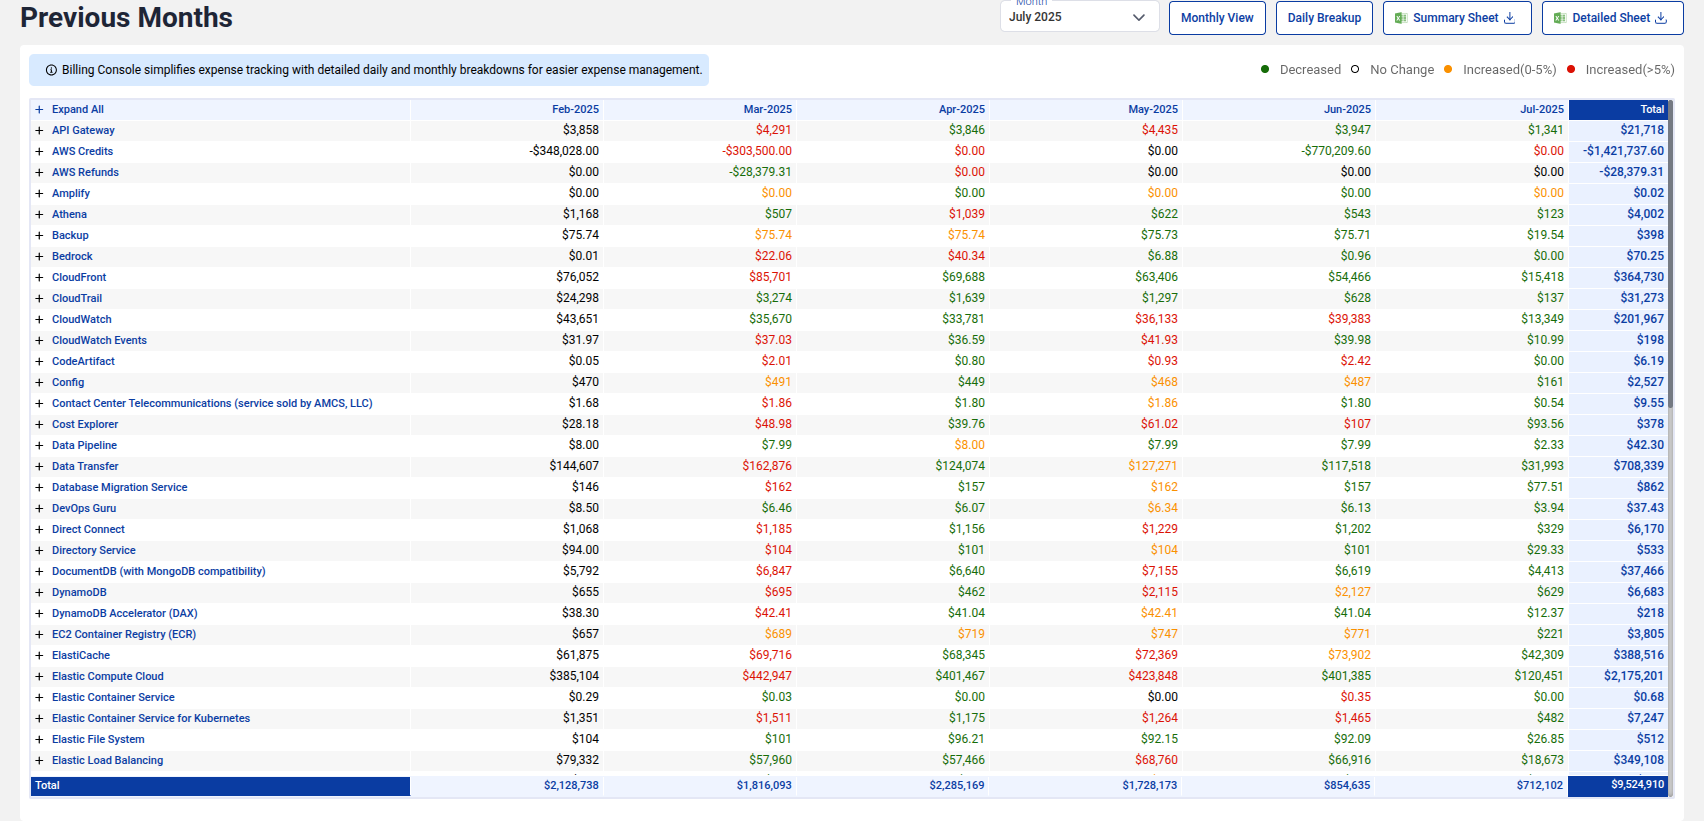
Service-wise Breakdown for Previous Month
The Service-wise Cost Breakdown displays your spending by service for the previous month. It helps you analyze where your costs are concentrated and identifies high-cost services.
- Elastic Compute Cloud (EC2): $120,000
- Simple Storage Service (S3): $150,000
- Data Transfer: $60,000
This breakdown allows users to dive into specific services that are contributing most to their cloud bill and to plan for optimization and cost reduction strategies.
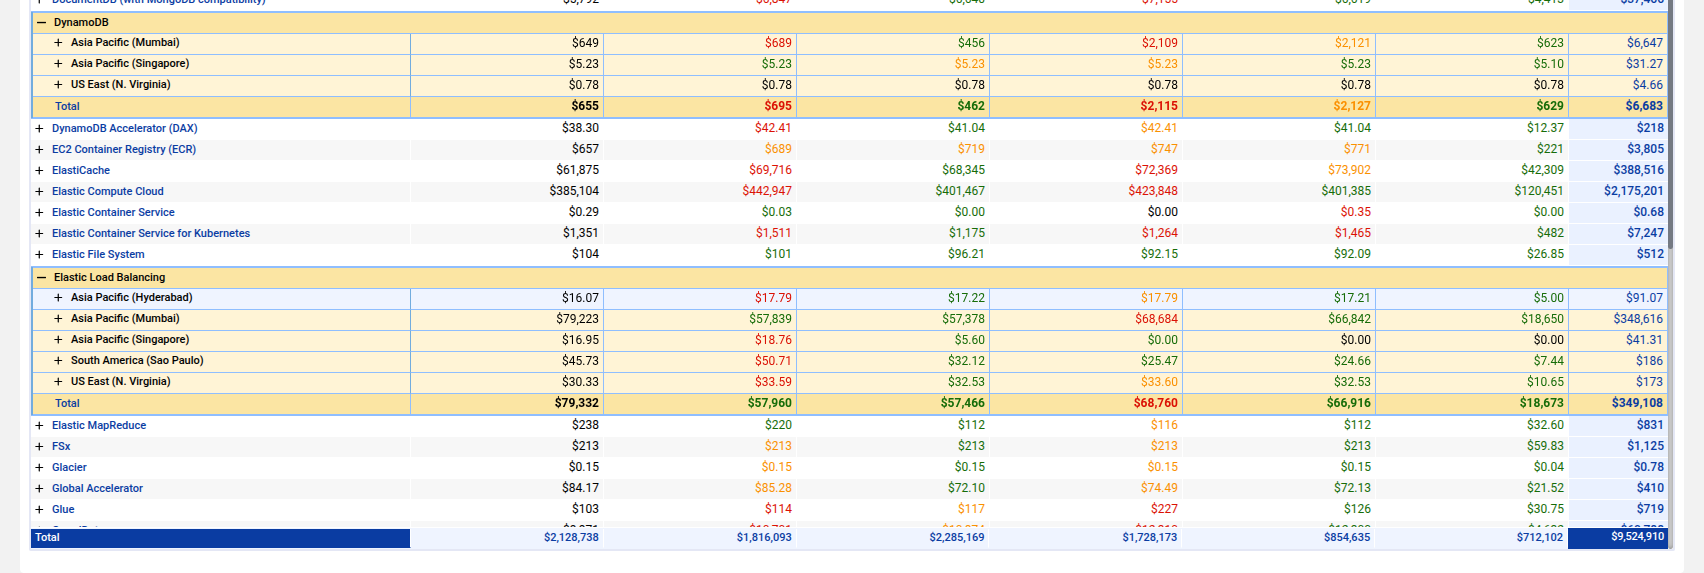
Breakdown by Region/Usage
The previous month's cost is further broken down by region and usage type. This section provides insights into where your costs are coming from geographically and which services have higher consumption.
- Asia Pacific (Mumbai): $50,000
- US East (N. Virginia): $30,000
This detailed breakdown helps you understand regional variations and optimize resource allocation.