Cost Explorer
The Cost Explorer is CloudKeeper Lens's most detailed and powerful tool for analyzing AWS spending. It allows you to drill down to the most granular levels to investigate cost trends, detect anomalies, and identify optimization opportunities.
It is designed to give you complete control and visibility over your AWS costs, down to the deepest levels. It empowers you to:
- Diagnose unexpected spikes
- Compare regions, services, and resources
- Create targeted cost optimization strategies
- Improve forecasting and budgeting
By combining powerful grouping, filtering, and visualization tools, Cost Explorer becomes an essential asset for your FinOps and engineering teams.
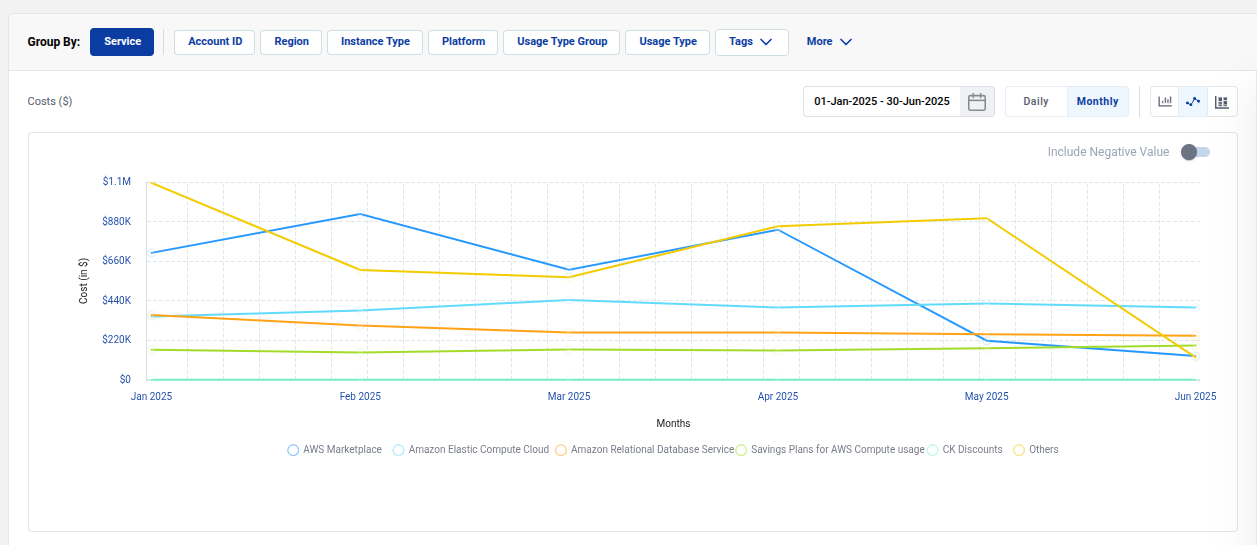
Group By Options
You can group your data in many ways to get targeted insights:
- Service
- Region
- Instance Type
- Account ID
- Platform
- Usage Type Group
- Usage Type
- Tags
- More options (e.g., Charge Type, API Operation, Resource, etc.)
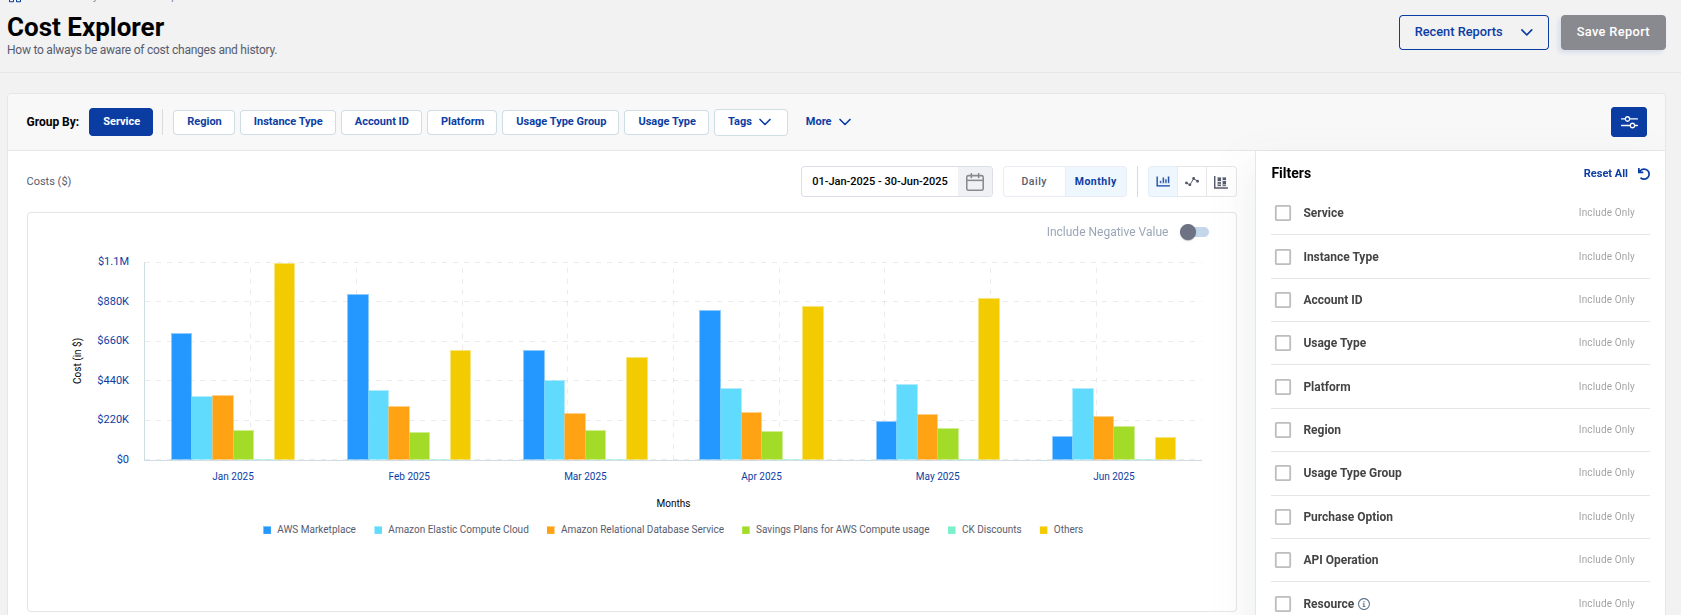
Filters
Refine your view using advanced filters:
- Service, Instance Type, Account ID
- Usage Type and Usage Type Group
- Platform, Region, Purchase Option
- API Operation, Resource
- Tags, Charge Type, Availability Zone
- Tenancy, Legal Entity, Billing Entity
Filters allow you to isolate exactly where costs are coming from, so you can understand why and how they are changing.
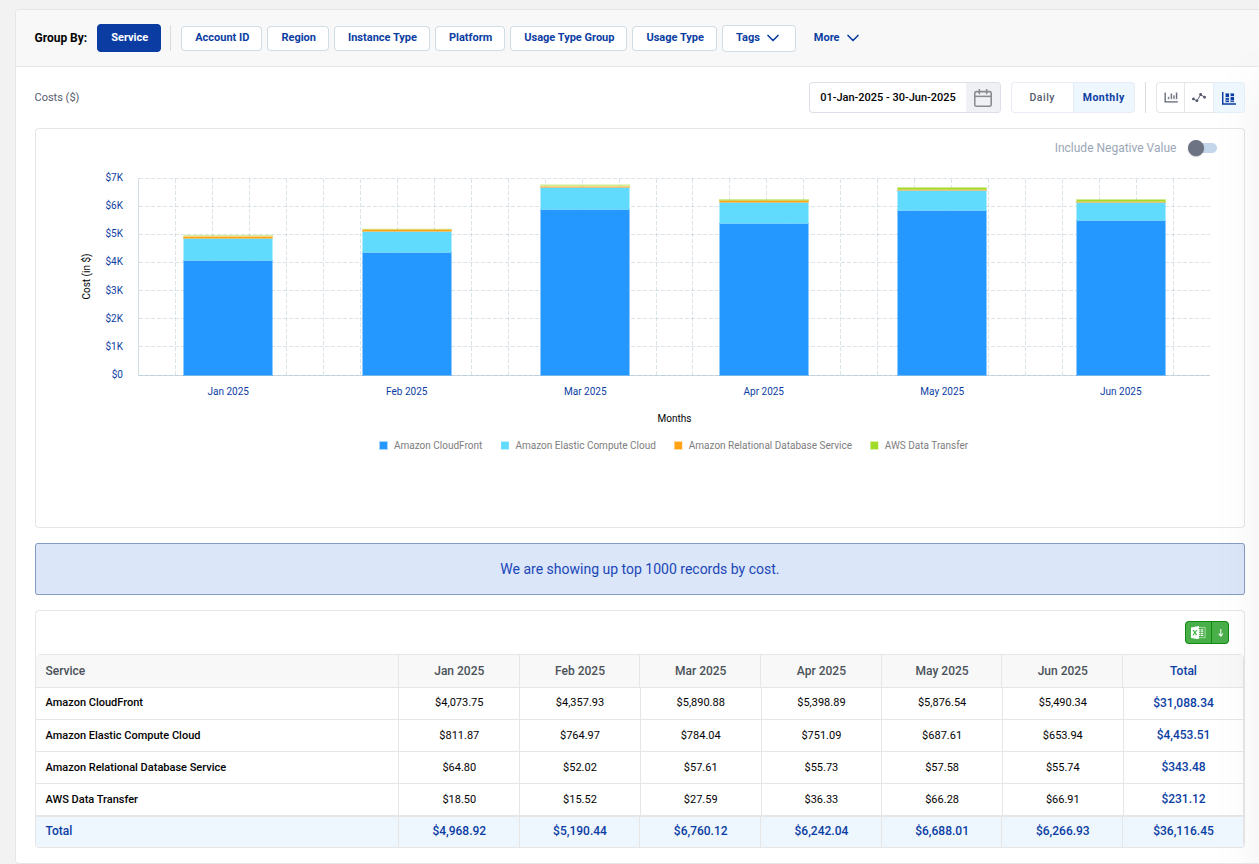
Service and Region Example
A common use case: you notice higher costs in a particular service. You can use Service Group By, and then apply a Region filter to find out which regions are driving that increase.
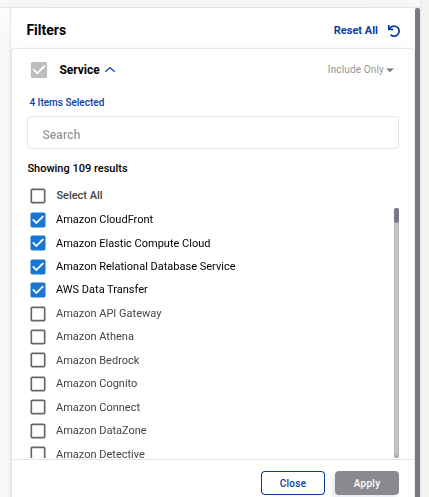
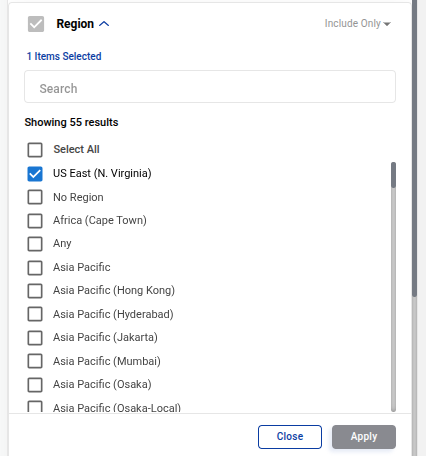
Resulting view:
API Operation Example
If you suspect a cost spike is due to specific API operations, you can use the API Operation filter.
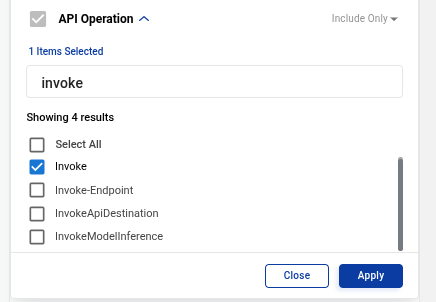
Resulting breakdown:
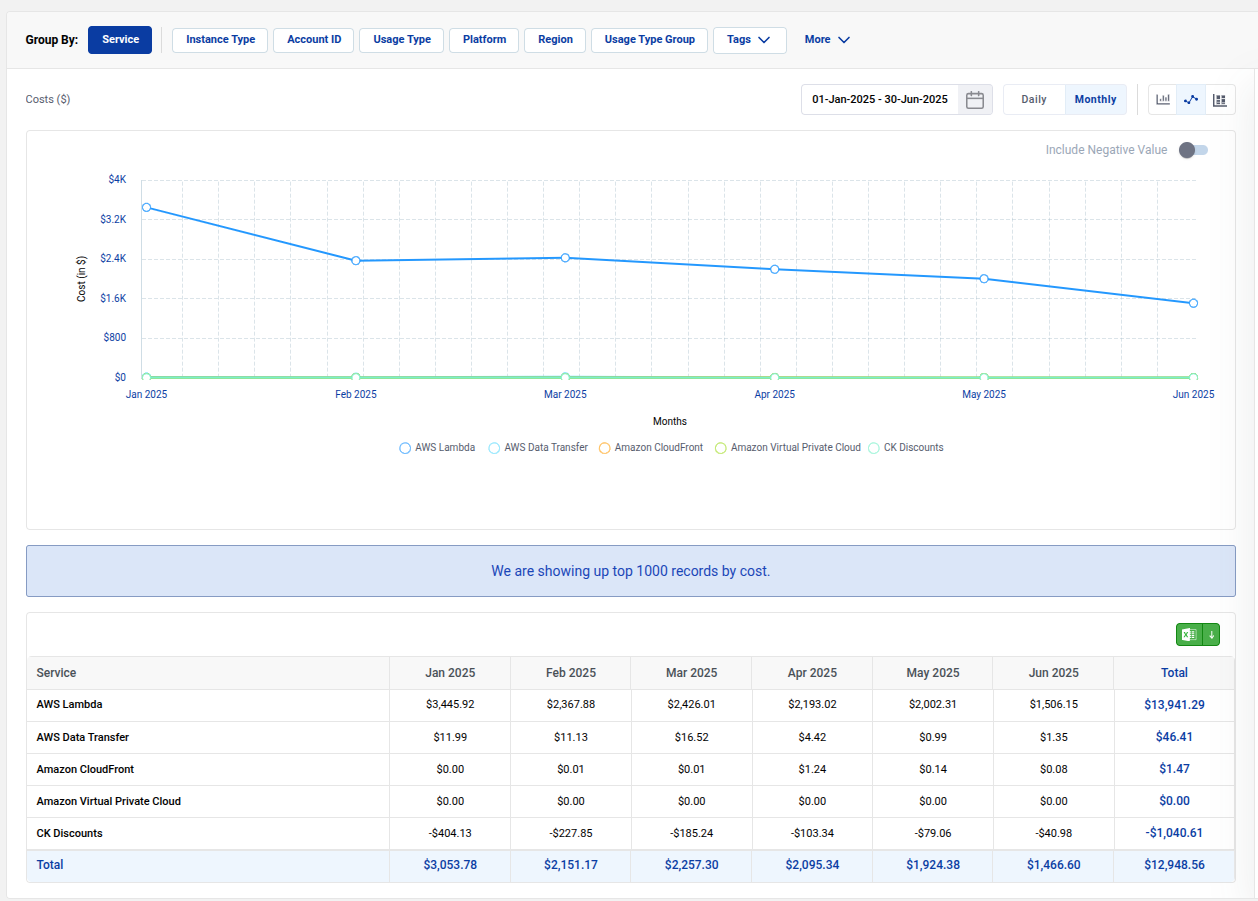
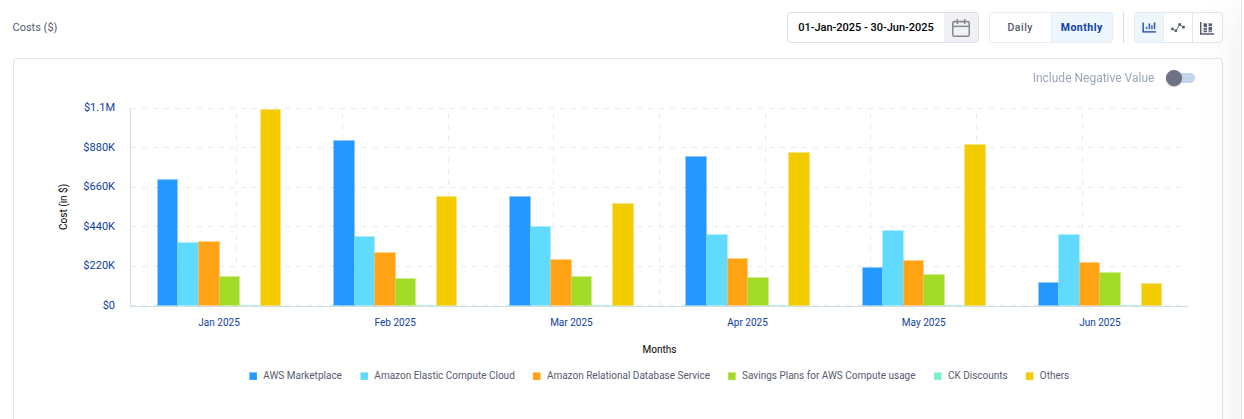
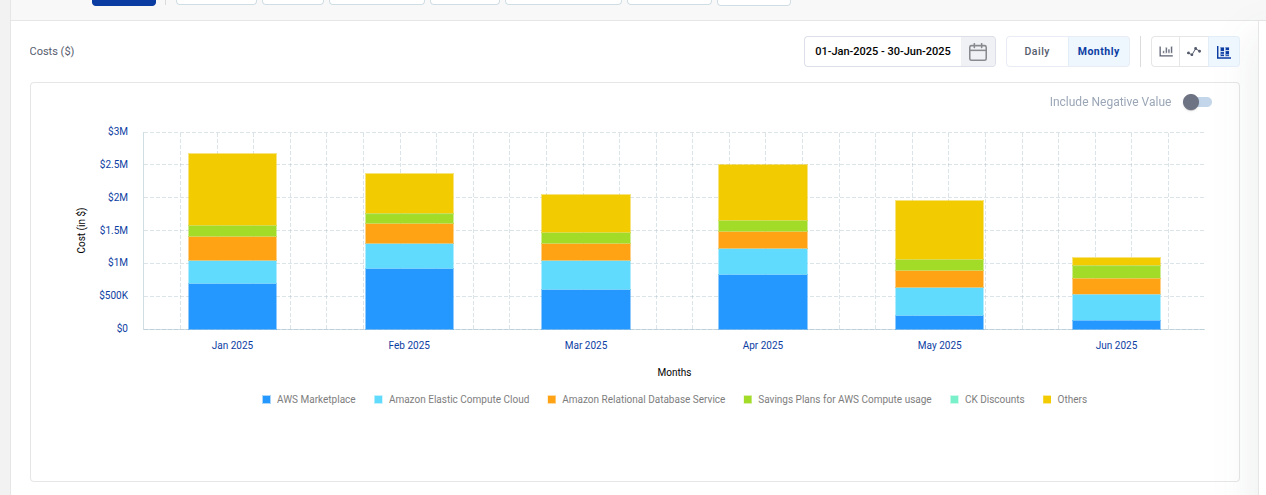
Chart Types
Cost Explorer supports multiple visualizations:
- Bar Charts
- Line Graphs
- Stacked Charts
Choose the format that best fits your analysis needs.
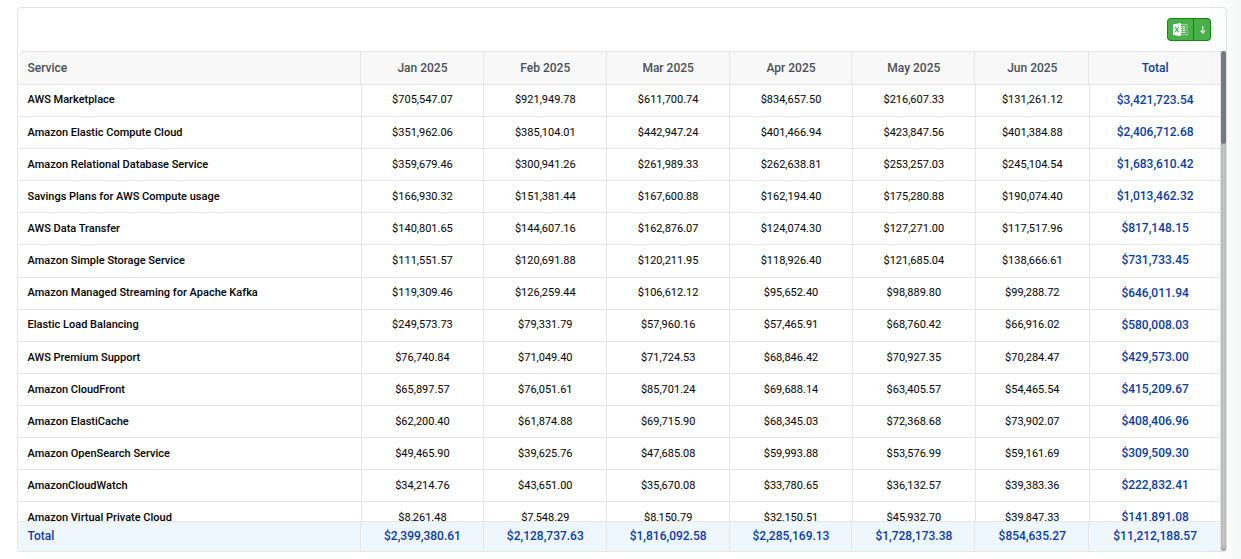
Tabular Cost View
Alongside charts, a detailed tabular breakdown is available, listing all services, costs by month, and totals. This helps with precise reporting and exporting.