Container Cost Allocation
The Container Cost Allocation dashboard in Cost Breakup provides deep visibility into containerized workloads running on EKS, ECS, and other orchestrated environments. It helps you analyze costs at granular levels by cluster, namespace, region, instance type, and more, allowing you to manage container costs efficiently and optimize resource usage.
Overview & Key Metrics
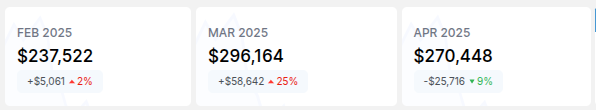
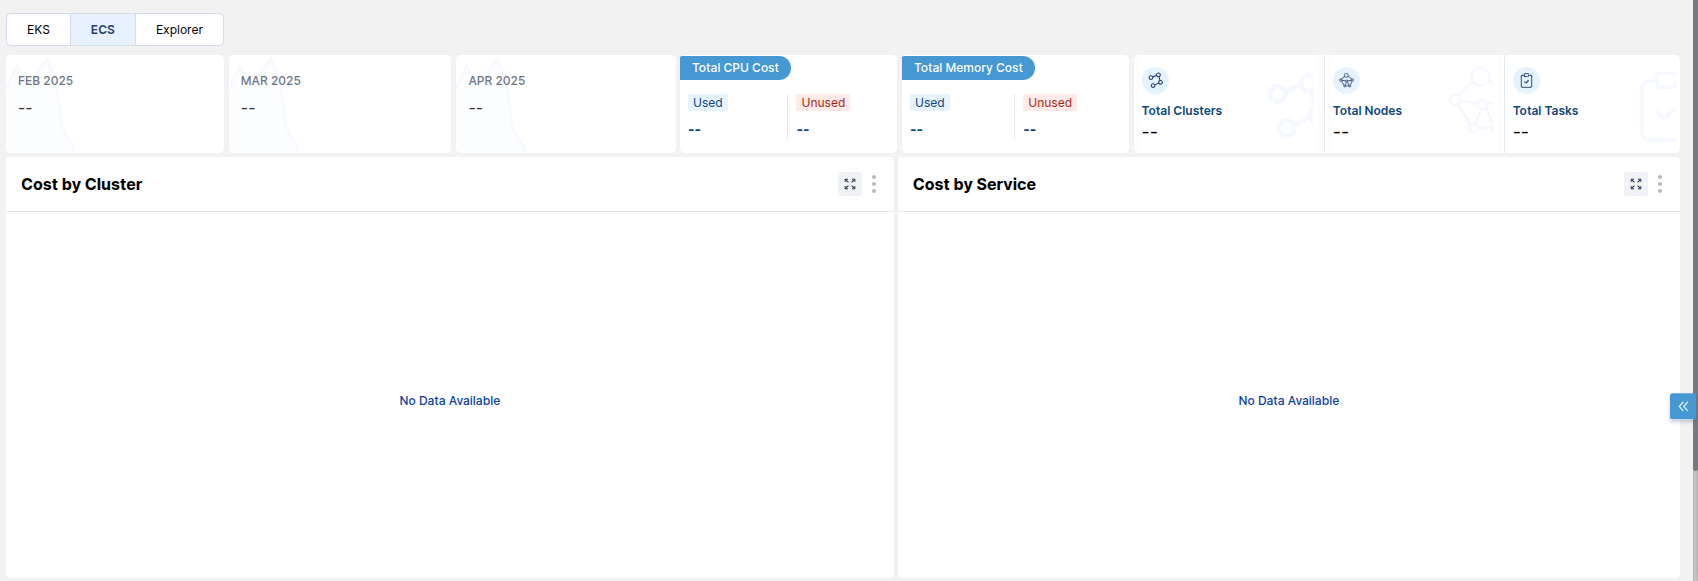
At the top of the dashboard, you’ll see high-level metrics showing:
- Total costs over the last 3 months with month-over-month trends.
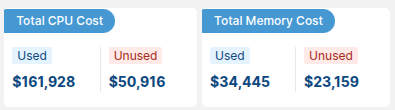
- Total CPU Cost and Memory Cost, split into Used and Unused. This highlights potential optimization opportunities.
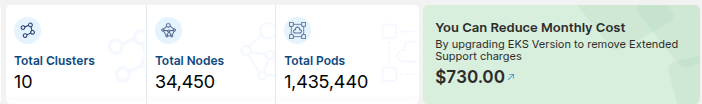
- Number of Clusters, Nodes, and Pods (or Tasks for ECS).
- Actionable recommendations to further reduce container costs (e.g., by upgrading EKS versions).
Cluster and Namespace Views
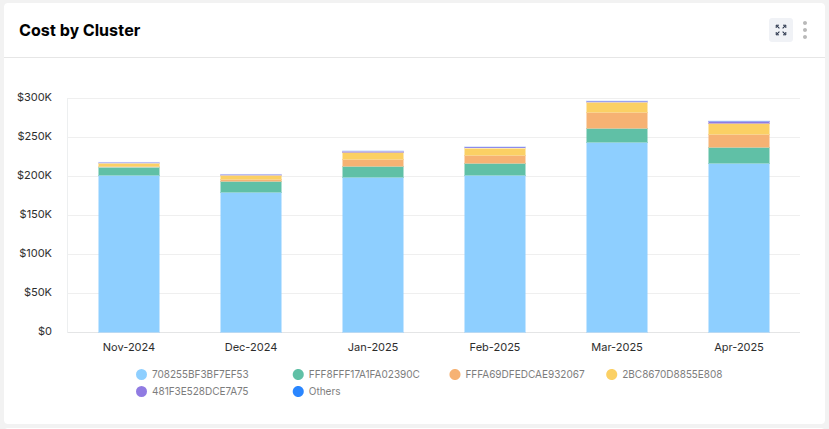
Cost by Cluster
Displays a stacked bar chart showing month-on-month costs distributed across clusters. Helps you understand which clusters are contributing most to the spend.
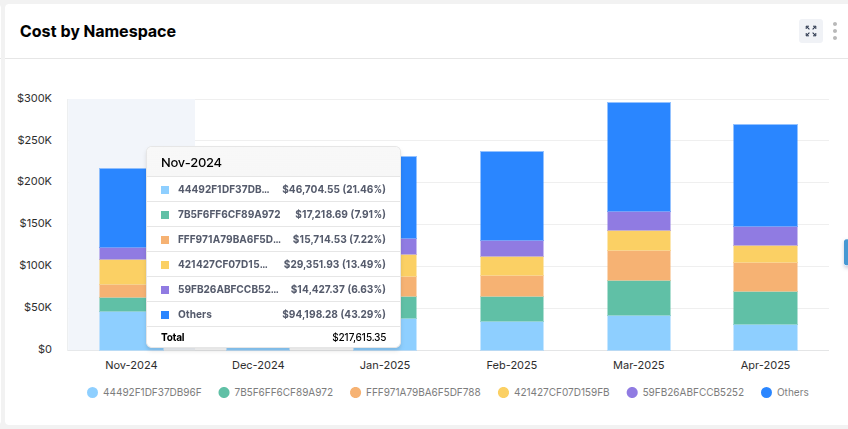
Cost by Namespace
Breaks down the cost further into Kubernetes namespaces, useful for identifying workloads or environments (e.g., dev, prod) with high costs.
Additional Views
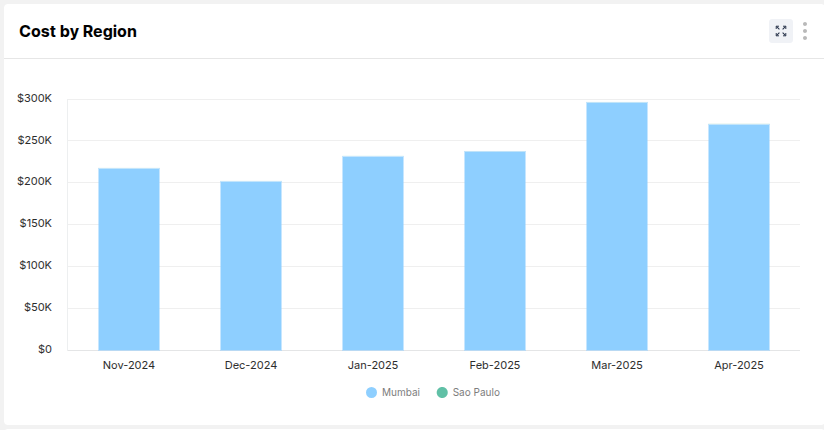
Cost by Region
Shows container costs split by AWS regions (e.g., Mumbai, Sao Paulo). Useful for regional optimization and understanding global footprint.
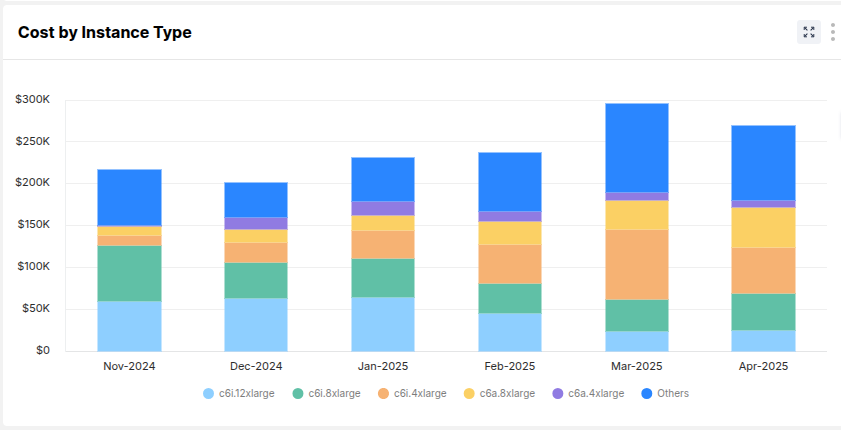
Cost by Instance Type
Displays how much each instance type (e.g., c6i.2xlarge, c6a.8xlarge) contributes to overall container costs. Helps with right-sizing and purchase strategy.
Cost by Purchase Type
Breaks down costs by On-Demand, Savings Plans, and Spot. This helps you analyze how much you are saving and where to optimize further.
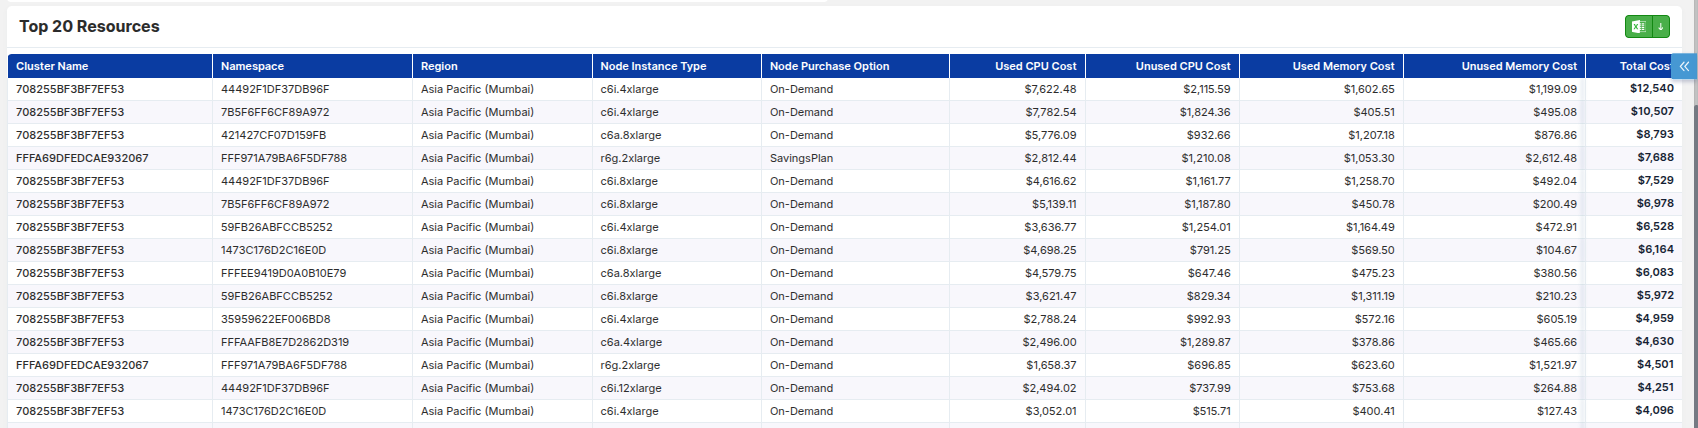
Top 20 Resources Table
Below the charts, a detailed table lists the Top 20 resources contributing to container costs. This includes:
- Cluster Name, Namespace, Region
- Node Instance Type, Purchase Option
- Used CPU Cost & Memory Cost
- Unused CPU Cost & Memory Cost
- Total Cost per resource
This helps identify specific workloads or nodes that might be overspending.
ECS and Explorer Views
ECS
Similar cost breakdown is available for ECS clusters and tasks, though data may vary depending on your environment. When there is no ECS data, the graphs and metrics appear empty.
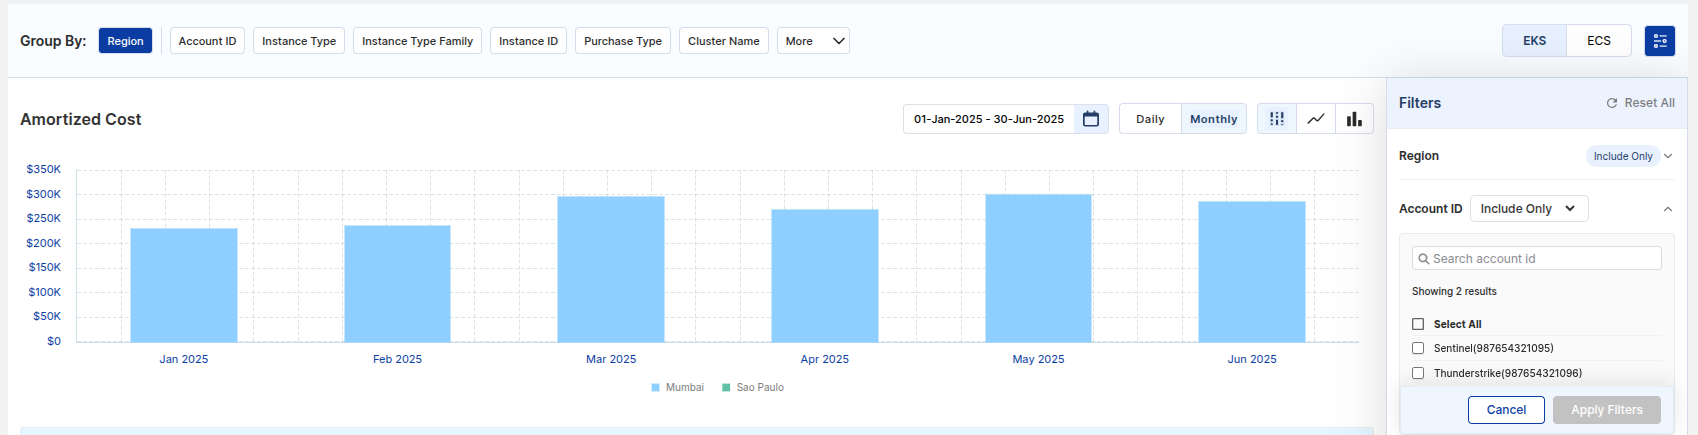
Explorer
The Explorer tab provides advanced grouping and filtering options. You can group costs by:
- Region
- Account ID
- Instance Type or Type Family
- Instance ID
- Purchase Type
- Cluster Name
- And more
You can also use detailed filters on the right side to drill down into specific clusters, instance types, or other dimensions.
Time granularity options allow you to switch between Daily and Monthly views, and toggle between different chart styles (bar, stack, line).
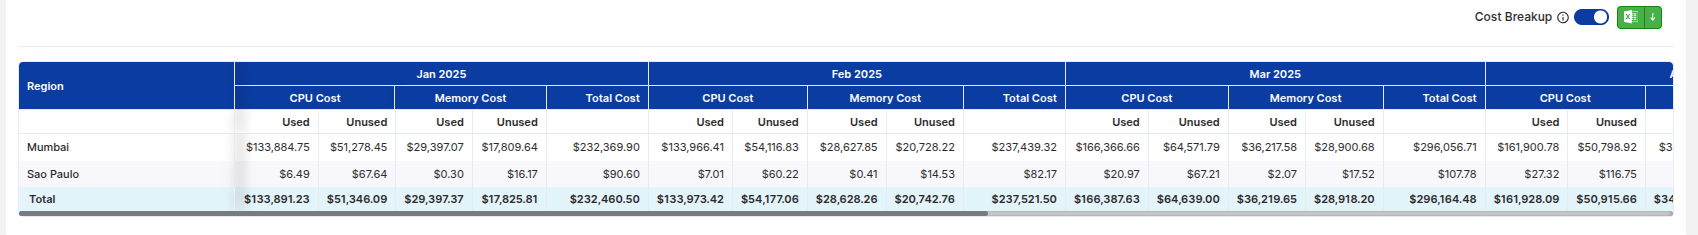
Downloadable Report
All data tables and charts can be exported to Excel for deeper offline analysis and sharing with stakeholders.