Data Transfer
The Data Transfer dashboard in Cost Breakup offers deep visibility into your data transfer spend patterns. It provides granular insights into transfer costs, types, services, regions, and individual resources, helping you optimize and manage cloud networking expenses.
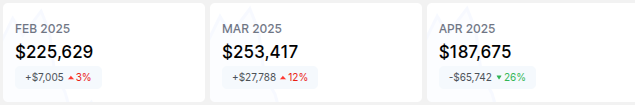
Overview & Key Metrics
At the top of the dashboard, you'll find key metrics showing month-on-month data transfer costs, including:
- Total cost for the last 3 months
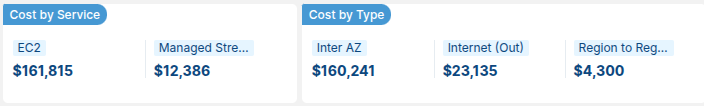
- Quick breakdown by service (e.g., EC2, Managed Streaming for Apache Kafka) and by type (e.g., Inter AZ (Availability Zone), Internet (Out), Region to Region)
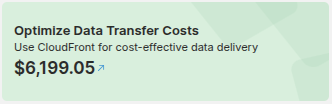
- Actionable recommendation to optimize costs
Transfer Types
- Inter AZ - Shows detailed cost trends of transfers between availability zones across different regions. Helps pinpoint which region is generating the highest inter-AZ costs.
- Region to Region - Displays transfers between specific AWS regions. A "To Region" filter allows you to select the target region and analyze which source regions contribute to those costs.
- Internet Out - Highlights costs incurred when data leaves AWS to the internet, broken down by region. Useful for analyzing external data delivery expenses.
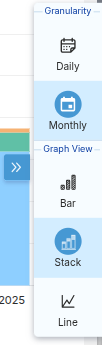
Graph Controls and Filters
On the right side of each graph, there is a dropdown menu to adjust granularity and graph type, allowing you to customize your analysis:
- Graph Type: Choose from Bar, Stack, or Line charts.
- Granularity: Switch between Monthly and Daily views.
Additionally, you can change the time frame of the data using the month selector at the top right, enabling historical trend analysis or focused short-term review.
Account and Type Views
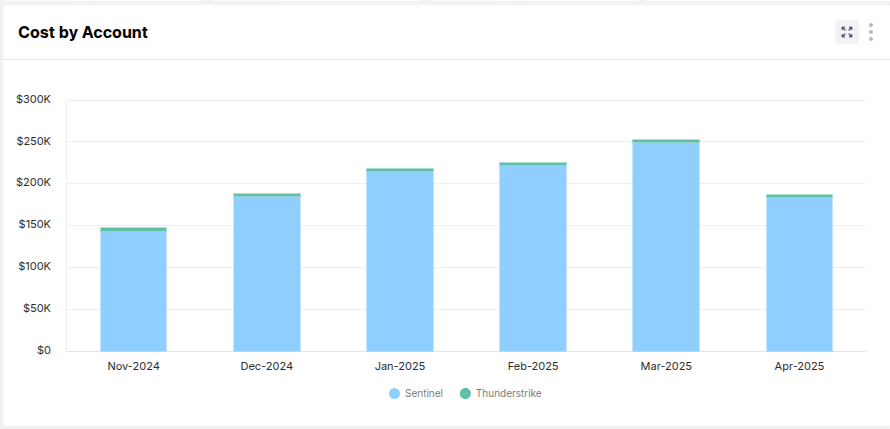
Cost by Account
Shows month-wise bar charts of data transfer costs by account (e.g., Sentinel, Thunderstrike). Helps identify accounts incurring high transfer charges.
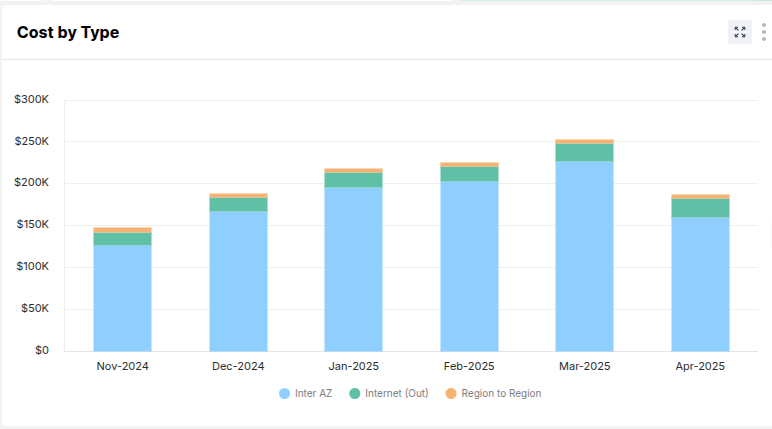
Cost by Type
Displays similar month-wise bar charts split by transfer type, allowing you to understand trends and changes over time.
Additional Views
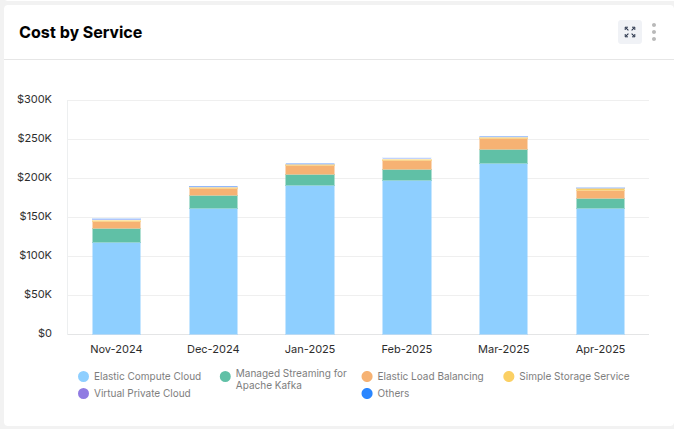
Cost by Service
A comprehensive bar chart breaking down data transfer costs across different AWS services over time. Examples include Elastic Compute Cloud (EC2), Elastic Load Balancing (ELB), Virtual Private Cloud (VPC), etc.
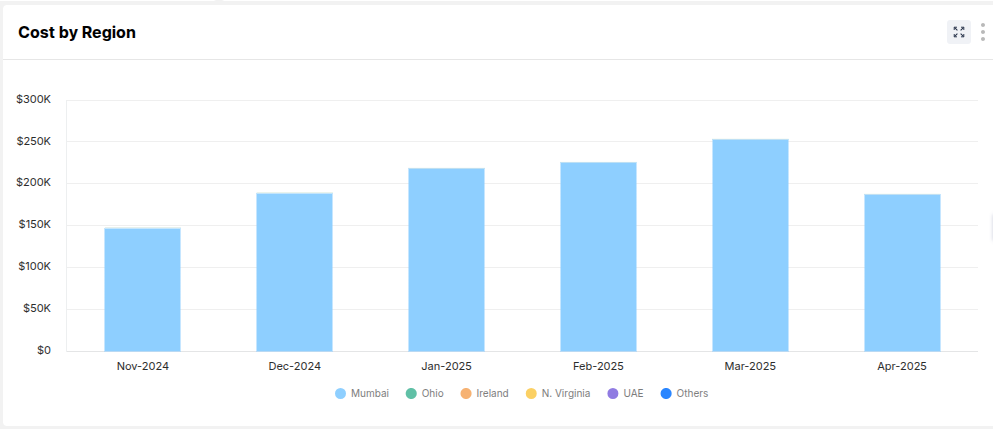
Cost by Region
Displays data transfer costs grouped by AWS regions (e.g., Mumbai, Ohio, N. Virginia). This highlights regions with heavy outbound or inter-region data movement.
Combined Views
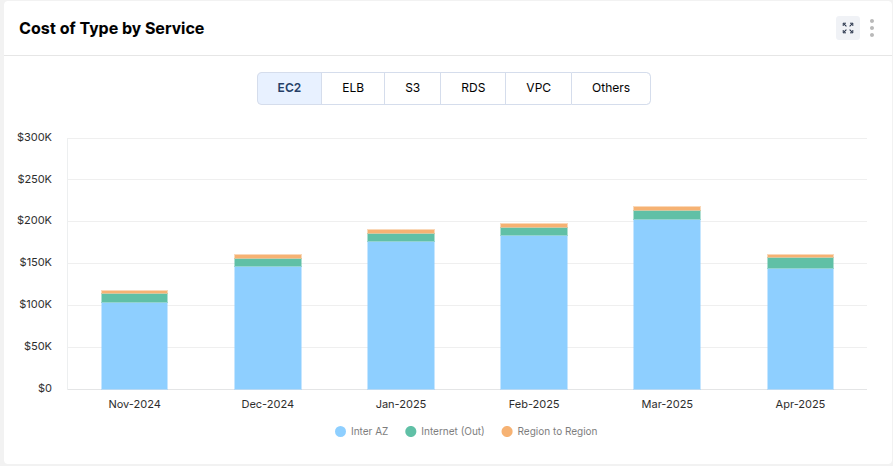
Cost of Type by Service
Enables filtering by service (e.g., EC2, ELB, S3). Displays how different data transfer types contribute to costs within that service.
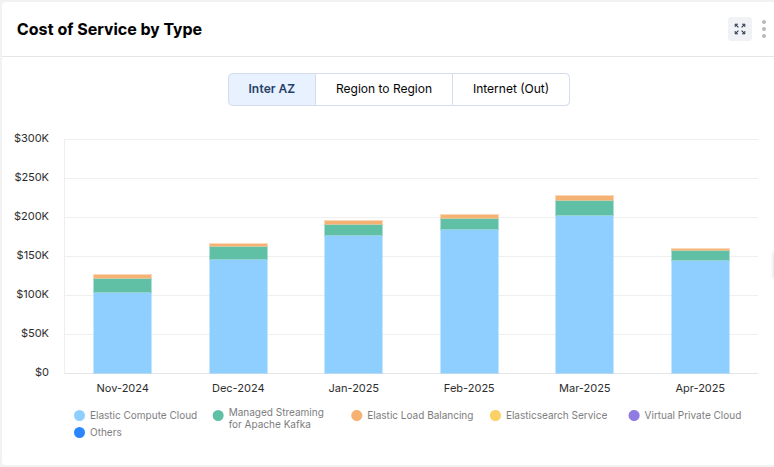
Cost of Service by Type
Allows filtering by transfer type (e.g., Inter AZ, Internet Out, Region to Region). Shows which services are using each transfer type the most.
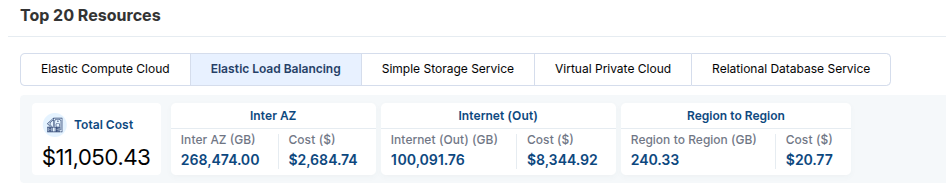
Top 20 Resources
A summarized view showing top 20 resources contributing to data transfer costs for selected services (e.g., EC2, ELB, S3). For each resource, you can see:
- Total cost
- Costs and quantities (GB) by Inter AZ, Internet Out, and Region to Region
This quickly identifies the most impactful resources.
Detailed Resource Table
Below the top resources, a detailed table shows:
- Account ID, Resource Name, Instance ID, Region
- Quantities and costs for each transfer type (Inter AZ, Internet Out, Region to Region)
- Total cost
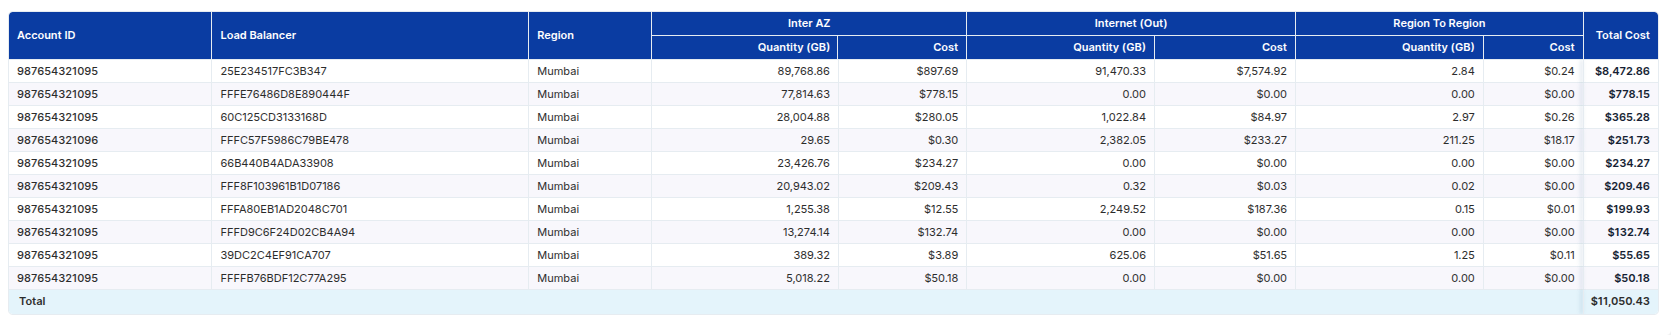
This enables precise analysis down to individual resources and supports data-driven optimization efforts.
Downloadable Report
You can export a detailed Excel sheet that includes all resource-level data. This is useful for further offline analysis or sharing with other stakeholders.