EC2 Hourly Dashboard
The EC2 Hourly Dashboard provides a granular, hour-by-hour view of your EC2 costs, enabling you to track per-day trends, understand spending spikes, and optimize your cloud workloads.
The Dashboard equips you with powerful insights to understand your hourly compute spend patterns, improve forecasting, and identify areas for cost savings and optimization. Leveraging these granular insights, your FinOps or engineering team can make smarter, data-driven decisions.
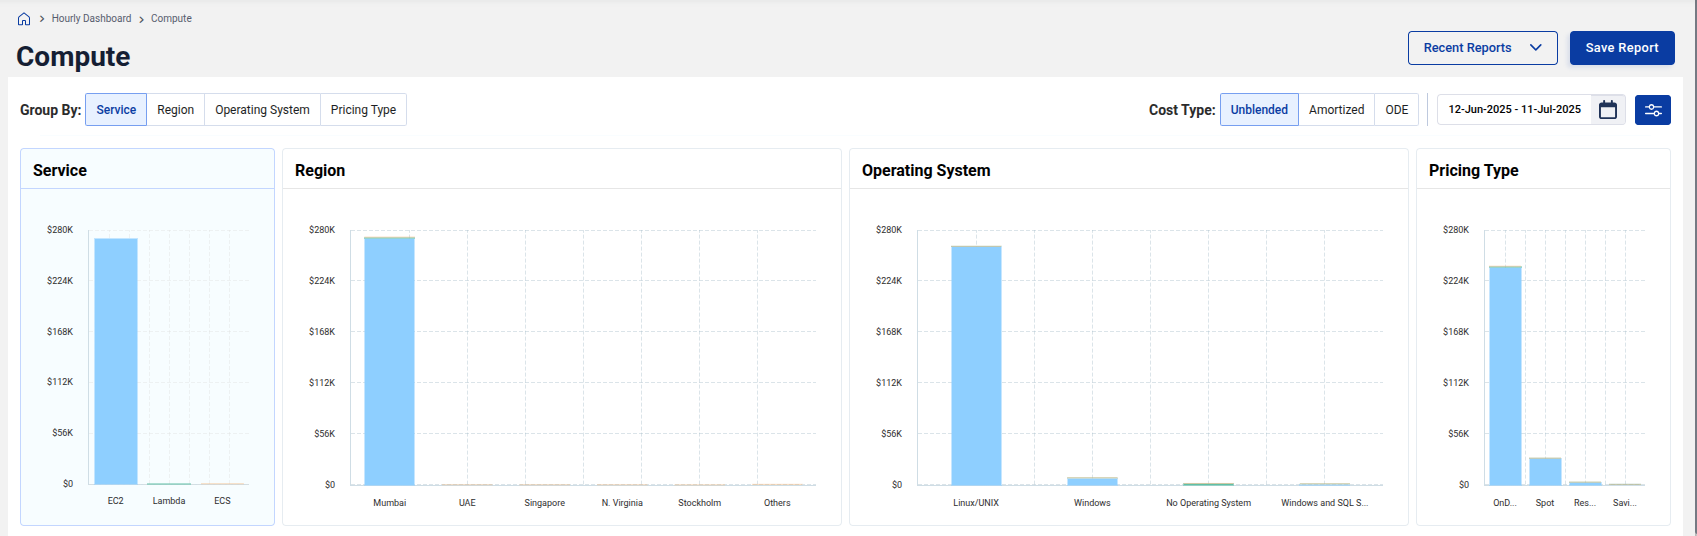
Overview and Filters
At the top, you can analyze costs by:
- Service
- Region
- Operating System
- Pricing Type
Additionally, you can toggle between Unblended, Amortized, and ODE cost types to see different financial perspectives. The flexible time range filter helps you examine specific windows (e.g., 12-Jun-2025 to 11-Jul-2025).
Cost Type Toggle Options
-
Unblended: Represents your actual, as-billed cost exactly as charged by AWS. In this view, any Reserved Instance (RI) or Savings Plan (SP) fees (upfront or recurring) are shown on the specific day they are invoiced. If you are charged a lump sum on the first of the month, the Unblended view shows that entire amount on that single day. It is your "raw" bill, reflecting exactly when charges hit your account without any smoothing.
Example: If you pay $1,200 for a one-year RI on January 1st, your Unblended cost for January 1st will include the full $1,200.
-
Amortized: Shows your effective, usage-aligned cost by taking those RI/SP commitment fees and dividing them evenly across each day of the billing period. This "accrual-basis" view provides your real daily cost by spreading out one-time fees to match when the resources are actually used. It removes the "spikes" in your data caused by billing dates, making it easier to see your true daily spend including the cost of your discounts.
Example: That same $1,200 RI would be divided by 365 days, showing a daily cost of approximately $3.28 every day of the year instead of a single $1,200 spike.
-
On-Demand Equivalent (ODE): Displays the cost of your usage as if every resource were billed at the standard On-Demand rate, ignoring any RI or SP discounts. This serves as a complete benchmark to show what you would have paid without any pricing commitments. By comparing your Amortized cost to your ODE, you can precisely quantify the total savings and efficiency gains generated by your current strategy.
Example: If an instance covered by an RI costs you $1.00/day (Amortized), but the standard price is $2.50/day, the ODE view will show $2.50.
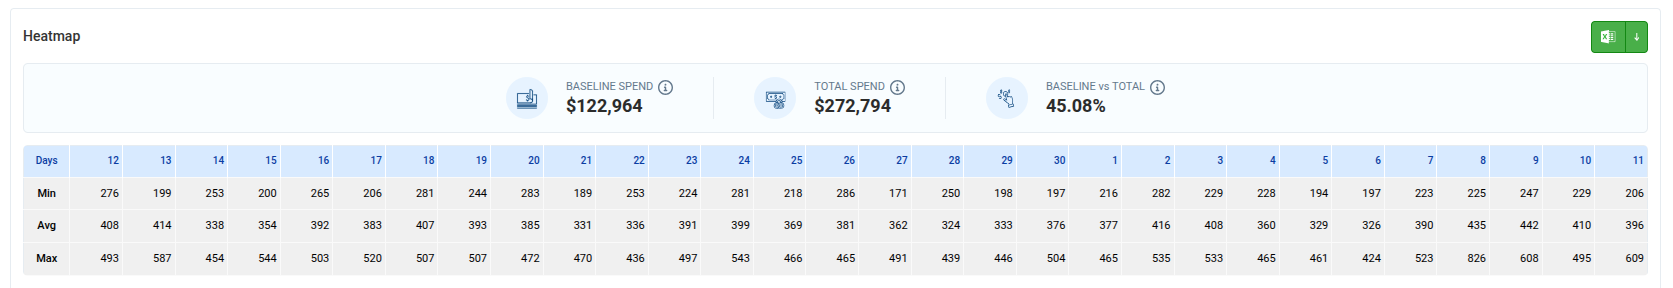
Cost Metrics
-
Baseline Spend: Represents the minimum possible compute cost for the selected period, calculated using your lowest observed hourly spend × total hours. It reflects your steady, always-on EC2 usage, the portion of cost that remains consistent regardless of demand, the amount you continue to incur even when workloads are at their lowest. This spend is ideal for committing to Reserved Instances (RIs) or Savings Plans (SPs) to achieve predictable savings.
-
Total Spend: Shows the actual EC2 cost incurred during the selected timeframe, including On-Demand, Reserved Instance, and Savings Plan usage depending on the chosen cost type. In simple terms, this is your real AWS EC2 bill covering all your compute consumption.
-
Baseline vs Total: Indicates the percentage of Total Spend represented by Baseline Spend, showing how much of your cost is steady versus variable.
Heatmap Insights
The heatmap visualizes your hourly cost trends, highlighting:
- Peak usage hours, which might correspond to autoscaling or batch processing activities.
- Idle or low-usage periods, presenting opportunities for cost optimization.
You can use this data to analyze patterns, understand scaling behavior, and plan for better instance scheduling. A consistent cost around the clock may indicate that you are not fully utilizing the elasticity of the cloud.
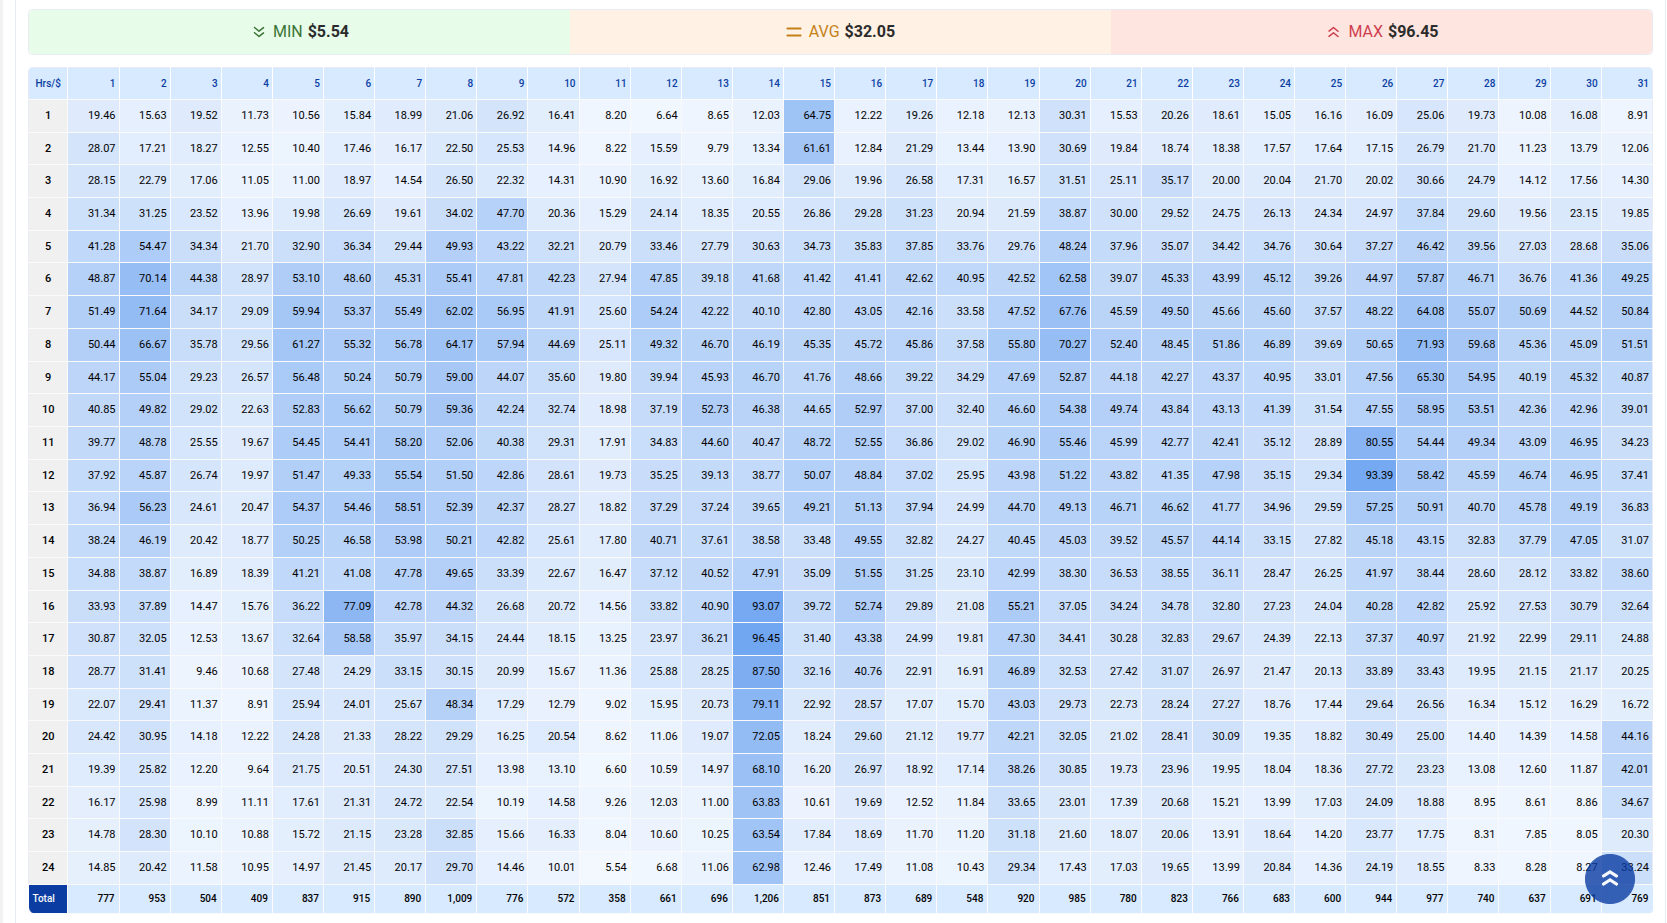
Detailed Hourly View
The detailed heatmap grid shows hour-by-hour costs per day, allowing you to drill down to the most granular level of compute usage.
- Identify unexpected spikes and analyze causes.
- Spot consistent baseline workloads and right-size accordingly.
Save and Load Reports
You can apply filters, generate specific views, and save reports for future reference. Saved reports allow you to quickly revisit your analysis or share it with stakeholders without reapplying filters each time.