Tag Reports
Tag Reports provide a consolidated cost view based on tags across multiple accounts, helping you analyze spend by environments, teams, or workloads.
Viewing Tag-Based Reports
Select a tag from the sidebar to explore its cost distribution across services and time.
- Costs are grouped by tag values (including Untagged)
- Data is aggregated across all linked accounts (MAV)
- Expand rows to drill down into service-level details
Monthly View
View the cost breakdown for a selected month.
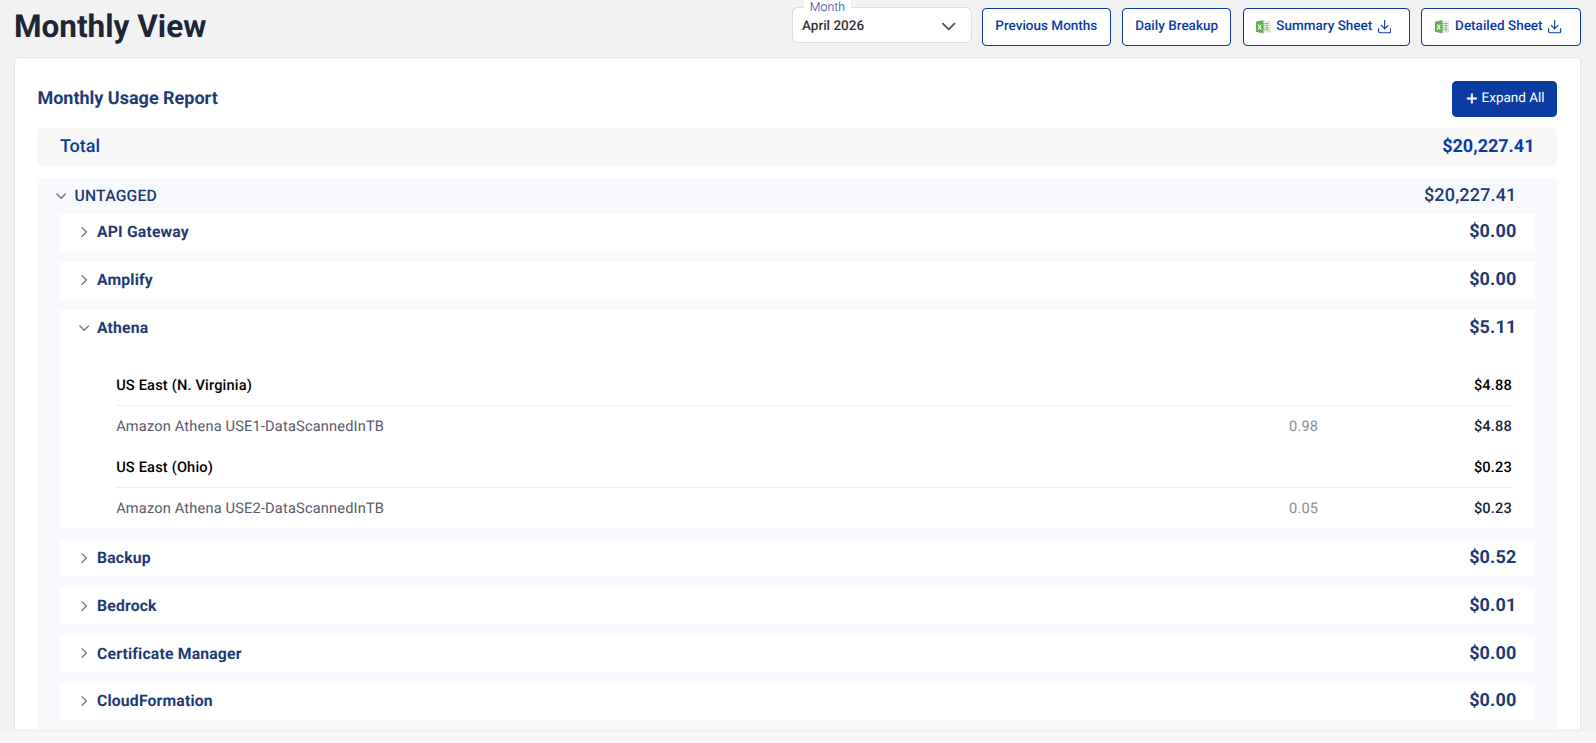
- Displays total spend grouped by tag values
- Expand services to view detailed usage
- Useful for understanding current month distribution
Previous Months
Analyze cost trends across multiple months.
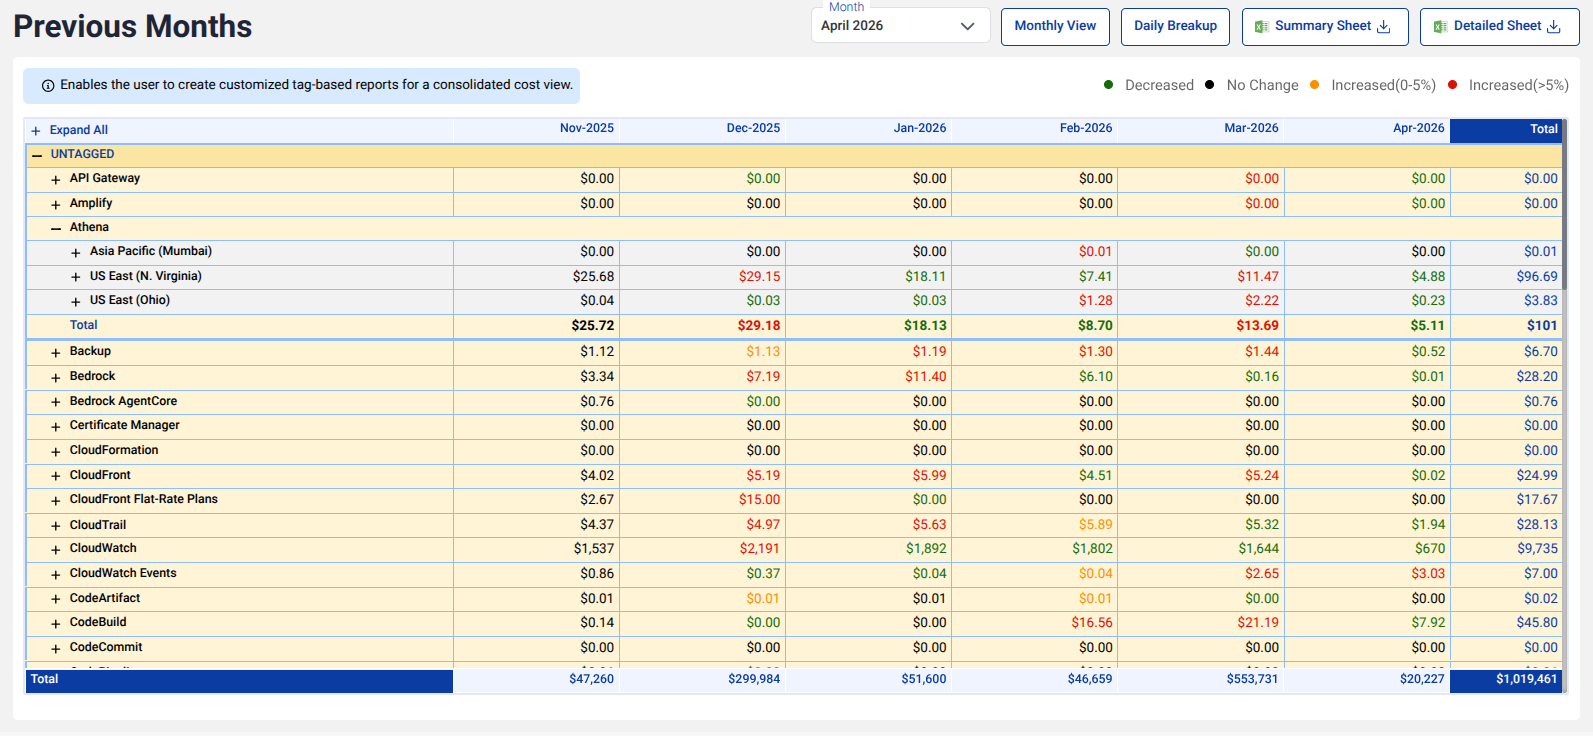
- Compare spending across months
- Identify trends and anomalies
- Color indicators highlight changes in spend
Daily Breakup
Drill down into daily cost patterns within a selected month.
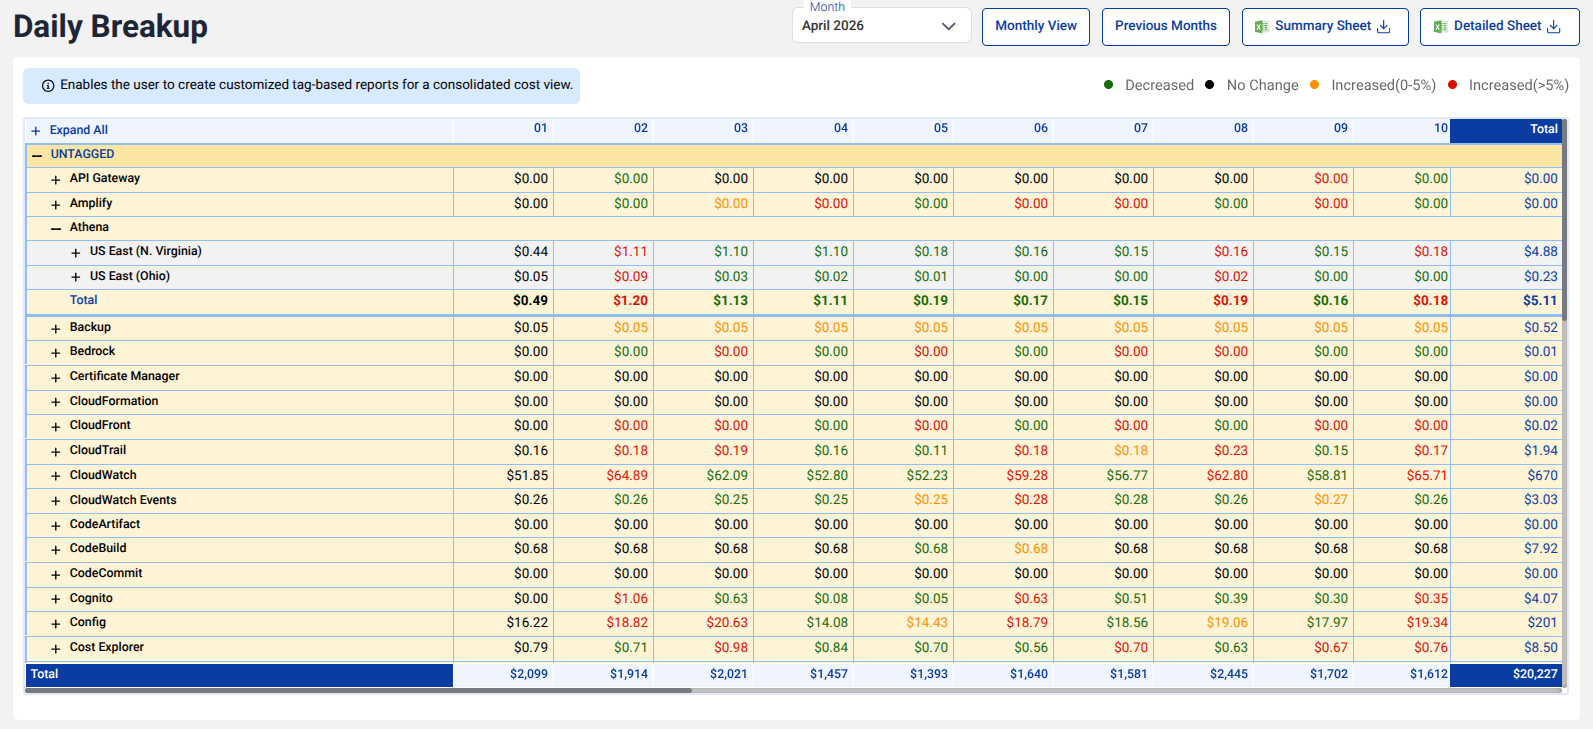
- Provides day-by-day cost visibility
- Helps detect sudden spikes or usage changes
- Enables faster investigation and action
Export Options
Download report data for further analysis or sharing.
- Summary Sheet: High-level grouped cost overview
- Detailed Sheet: Service-level and daily breakdown