Reservation Coverage
The Reservation Coverage page provides insights into how much of your usage is covered by Reserved Instances (RIs) compared to On-Demand usage. It helps users track the effectiveness of their Reserved Instance purchases and identify opportunities for cost optimization.
A Better Way to Measure Coverage
A key differentiator of CloudKeeper Lens is that it measures reservation coverage in monetary value ($) rather than usage hours. AWS calculates coverage based on usage hours, which can be misleading. For example, 30 unused hours of a small instance and 30 unused hours of a large, expensive instance are treated the same, even though the financial impact is vastly different.
Lens provides a more accurate picture by showing the actual dollar amount of your On-Demand spend that is covered by reservations. This helps you understand the true financial impact of your RI and Savings Plan portfolio.
Key Features of Coverage Page
- Coverage Percentage: This metric shows the percentage of your On-Demand costs (in dollars) that are covered by reservations.
- Total On-Demand Cost: Displays the total cost of On-Demand instances during the selected time period.
- Average Coverage: The average coverage over a specified period, helping you identify if your Reserved Instances are effectively utilized.
Coverage Insights for Different Services
You can monitor the coverage for different services such as EC2, RDS, ElastiCache, and OpenSearch. The graph helps you identify how much of your usage for each service is covered by your Reserved Instances.
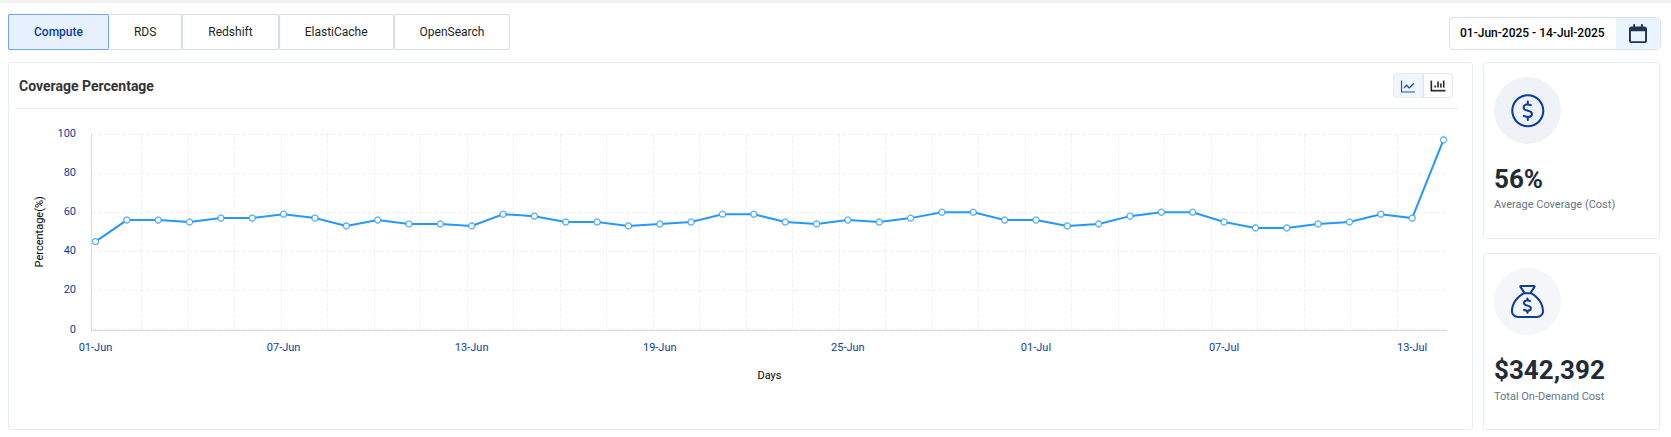
Example: EC2 Coverage
Here is an example of how EC2 coverage is tracked over time. You can see the percentage of usage covered by Reserved Instances on the graph. The insights help users track their usage and determine if more Reserved Instances are needed.
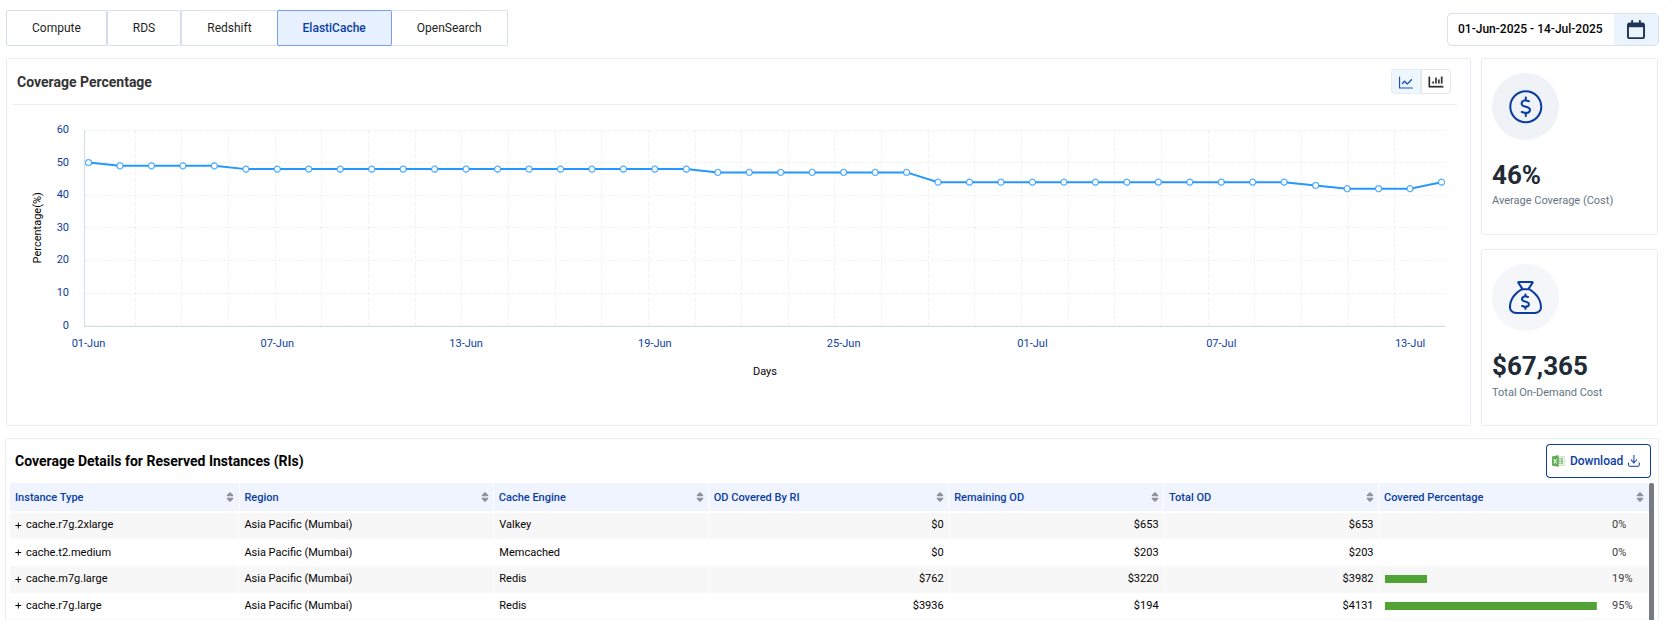
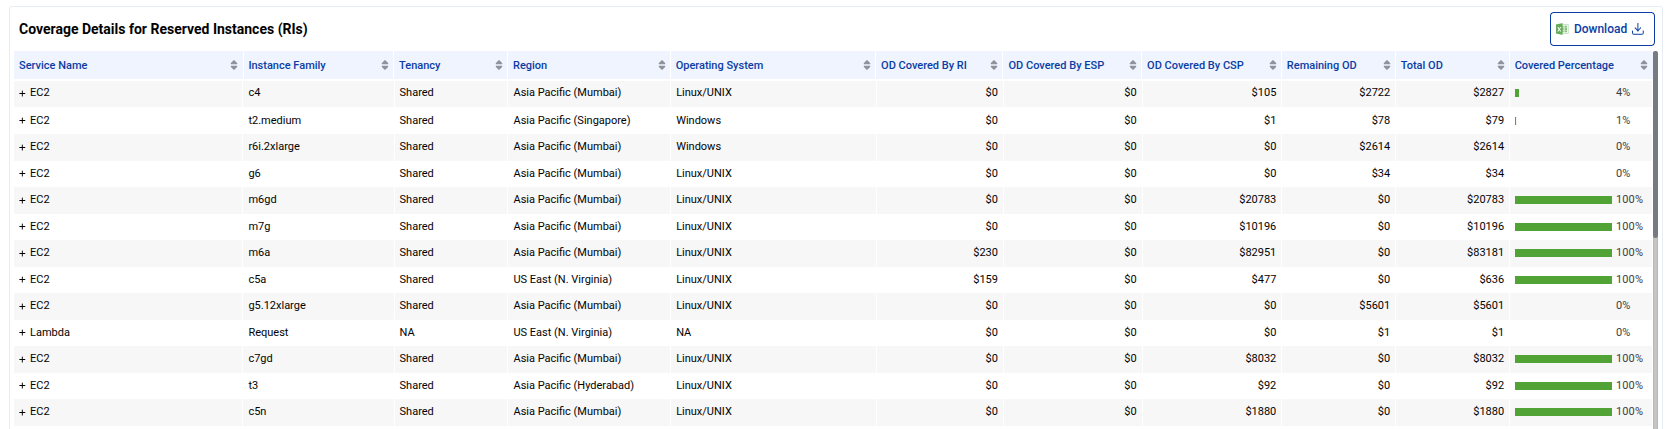
Coverage Details for Reserved Instances (RIs)
This section breaks down the coverage details for each instance type and region. It shows how much of the On-Demand usage is covered by Reserved Instances and the total On-Demand cost for each instance type.
- Service Name: The specific AWS service (e.g., EC2, Lambda).
- Instance Family: The type of instance (e.g., m5.large, t3.medium).
- Tenancy: Whether the instance is shared or dedicated.
- Region: The region where the instance is running (e.g., Asia Pacific, US East).
- OD Covered By ESP: The amount of On-Demand cost covered by Enterprise Savings Plan.
- OD Covered By CSP: The amount of On-Demand cost covered by Customer Savings Plan.
- OD Covered By RI: The amount of On-Demand cost covered by Reserved Instances.
- Remaining OD: The remaining On-Demand cost that is not covered by RIs.
- Total OD: The total On-Demand cost including both the covered and uncovered portions.
- Covered Percentage: The percentage of your usage that is covered by Reserved Instances.
This helps in tracking which instances are underutilized and which are optimized for savings.
Tracking Coverage for Different Services
The coverage percentage for EC2, RDS, Redshift, ElastiCache, and OpenSearch can be monitored separately. These insights allow you to see how well each service is covered and help you decide if additional Reserved Instances are needed for underutilized services.
Example: ElastiCache Coverage
You can track the coverage for services like ElastiCache, ensuring that your services are adequately covered by RIs and helping reduce On-Demand costs.